
Customer Contracts Kibana
Customer Contracts Kibana visualizations are new with FSCM 9.2 Image 37. These visualizations allow the organization to review the customer contracts base and make key decisions.
The dashboard consists of the following visualizations:
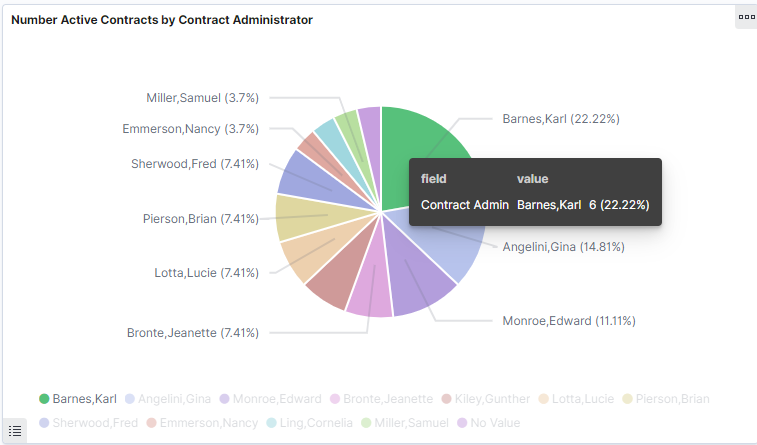
- Number Active Contracts by Contract Administrator
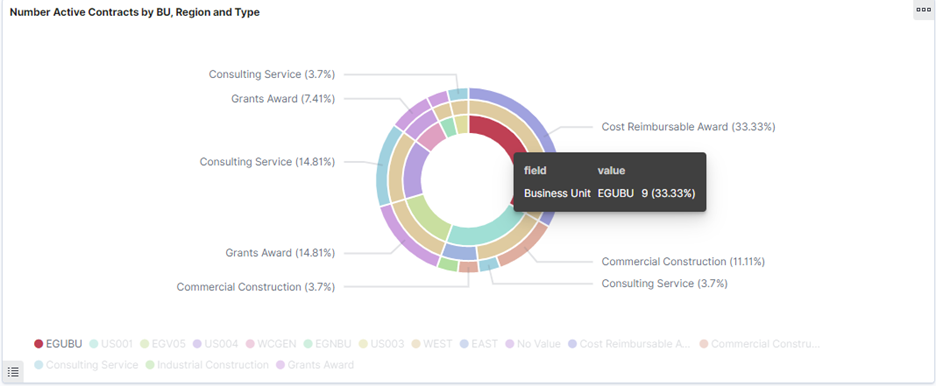
- Number Active Contracts by BU, Region and Type
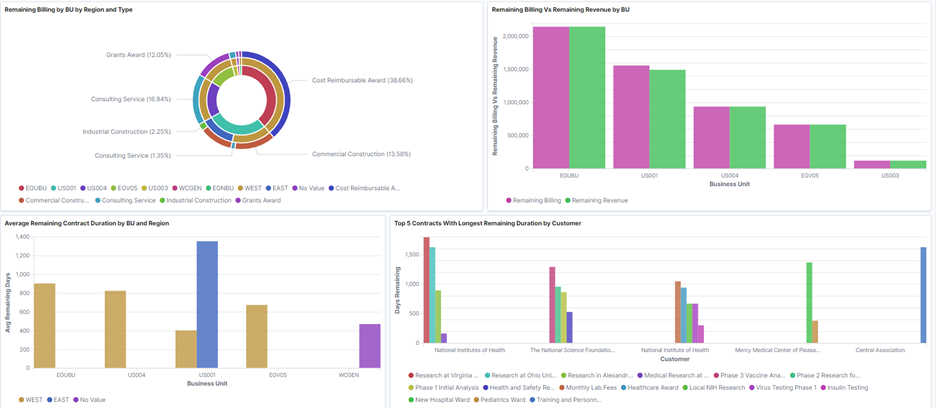
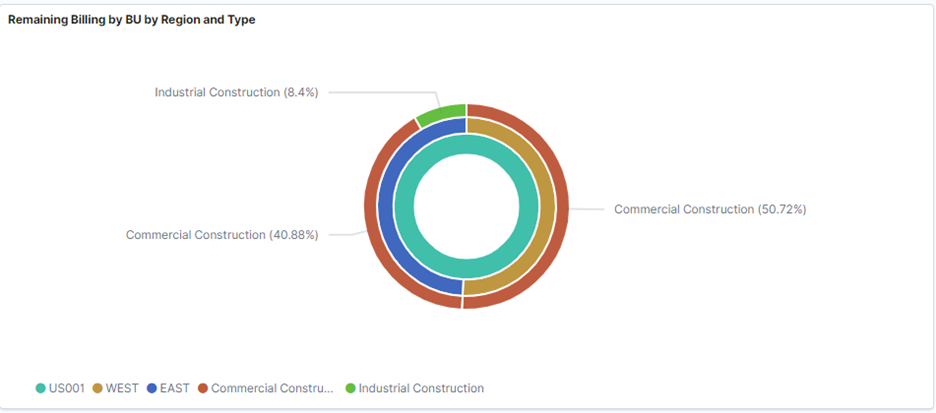
- Remaining Billing by BU by Region and Type
- Remaining Billing vs. Remaining Revenue by BU
- Average Remaining Contract Duration by BU and Region
- Top 5 Contracts with Longest Remaining Duration by Customer
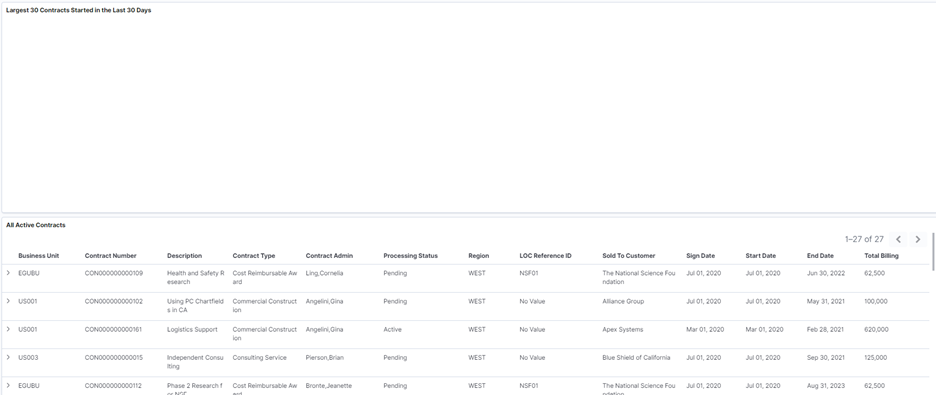
- Largest 30 Contracts Started in the Last 30 Days
- All Active Contracts.
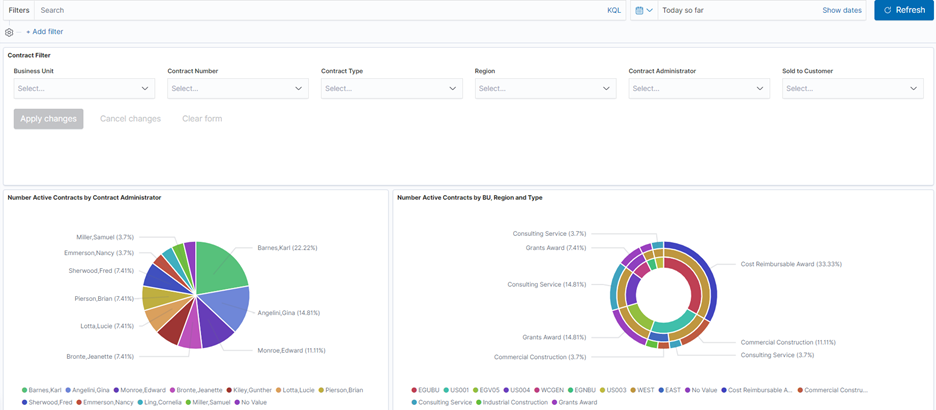
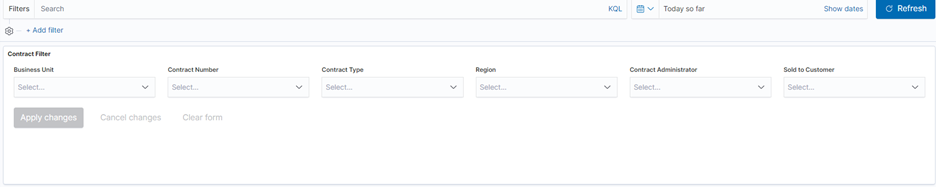
It should be noted that all visualizations are connected. Any filters applied will be reflected in all visualizations. Filters can be applied by:
- Business Unit
- Contract Number
- Contract Type
- Region
- Contract Administrator
- Sold to Customer.
The Active Contracts by Contract Administrator visualization shows the number of contracts for that administrator and what percentage they make up of all contracts.
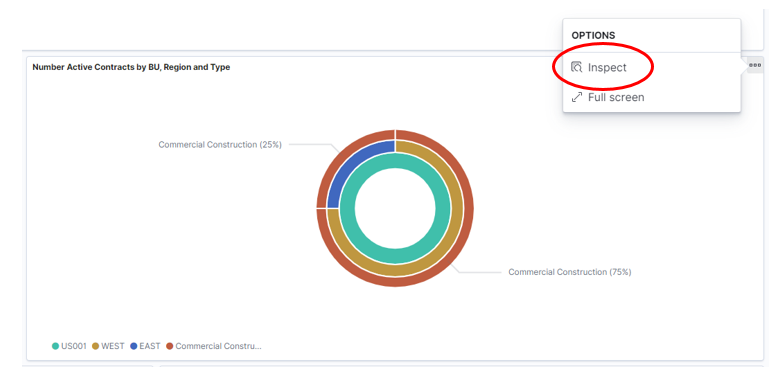
The Active Contracts by BU, Region and Type visualization shows those values and the percentage they make up of all contracts.
The next visualization shows Remaining Billing by BU by Region and Type.
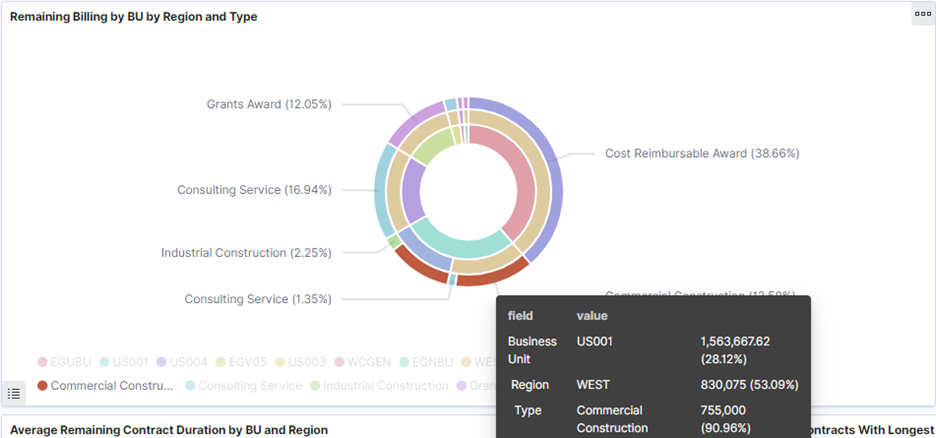
It should also be noted that when a visualization is clicked, you can filter down. Applying filters will be shown for the remaining visualizations. In this case, we filtered on Business Unit US001.
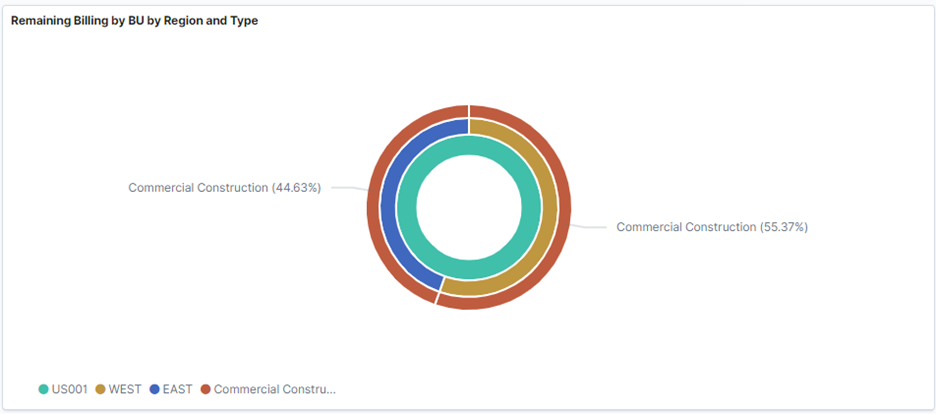
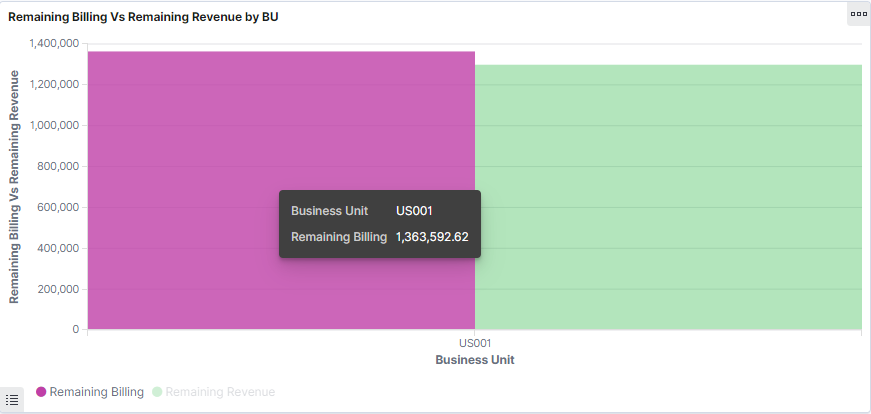
You can see the next visualization only reflects US001. This visualization reflects the Remaining Billing vs. Remaining Revenue. In this case, it is for all of Business Unit US001.
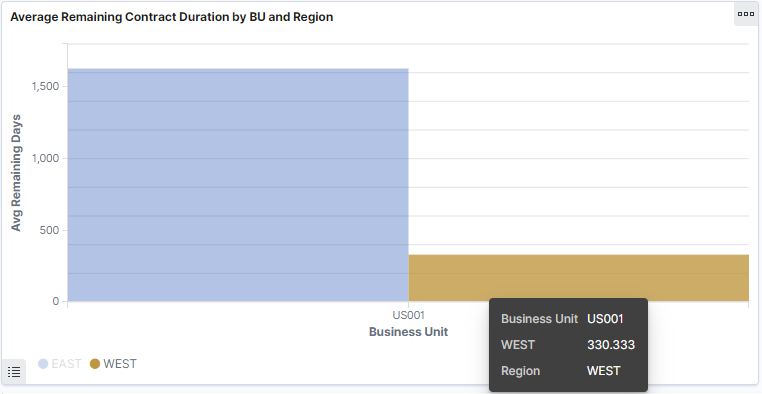
The next visualization represents the Average Remaining Contract Duration by BU and Region in days. In this example, US001 has East and West Regions.
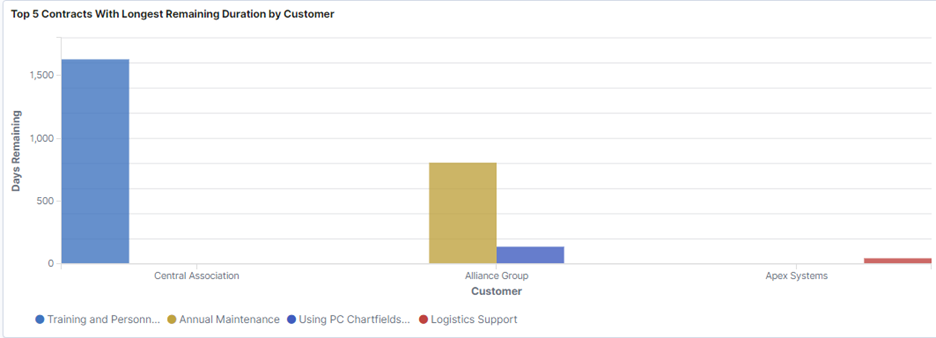
The next visualization represents the Top 5 Contracts with Longest Remaining Duration by Customer.
In our demo environment, we do not have any, but this visualization represents the largest 30 contracts started in the last 30 days.
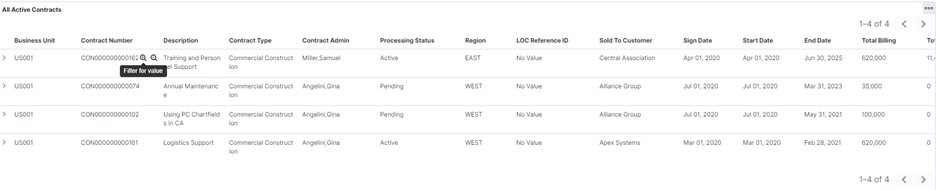
Finally, we can see all the data related to All Active Contracts. Please note there are filters in each field. In this case, we could apply the filter at the contract number. That filter would then apply across all visualizations.
Additionally, under each of the visualizations we can see the underlying data by clicking the three dots in the upper right hand corner of the visualization and selecting INSPECT.
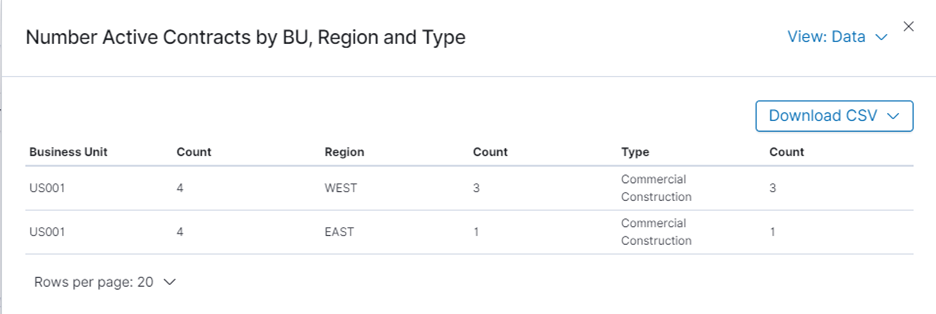
In this case we can see the data that makes up the visualization chart. We can download to CSV and apply filters here.
Finally, you can also enter a key word for filtering. For example, enter the word “Grant”. The visualizations will only pull data for contracts having the key word “Grant”.
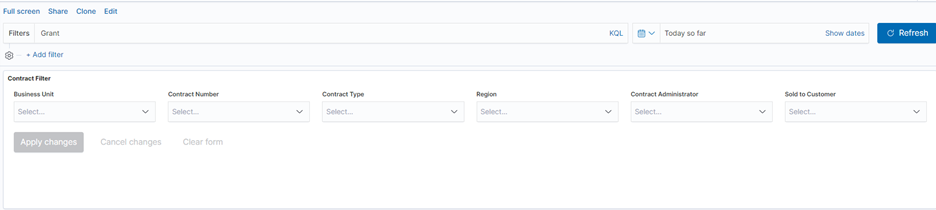
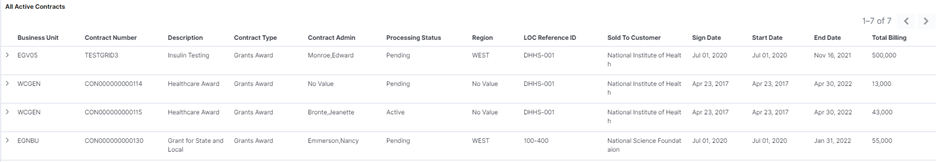
Or perhaps search on “Construction”.
For more Kibana blogs, visit:
If you would like more information on Customer Contracts Kibana, please reach out to me at larry.zagata@miproconsulting.com.