
- April 27, 2021
- Larry Zagata
- Blog
New with HCM PUM Image 37 are Health and Safety Kibana Analytics. Let’s explore the different types of analytics now available.
We will begin by using the Regulatory Region, Location and Establishment filters and applying them to the entire dashboard.
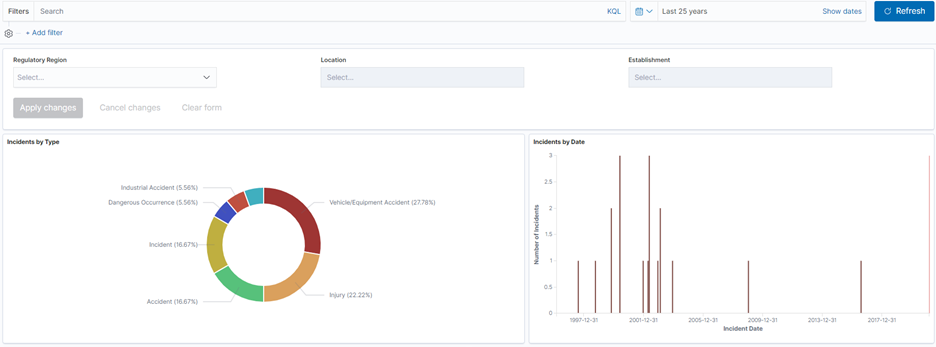
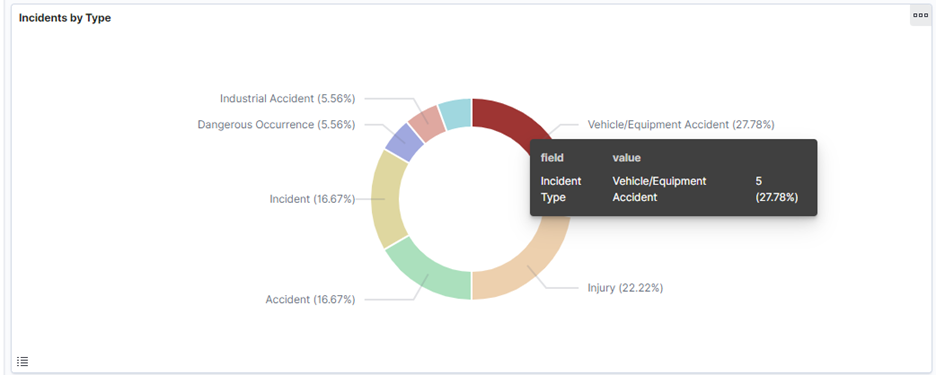
The first available analytic is Incidents by Type. You can hover over each area to get the specifics.
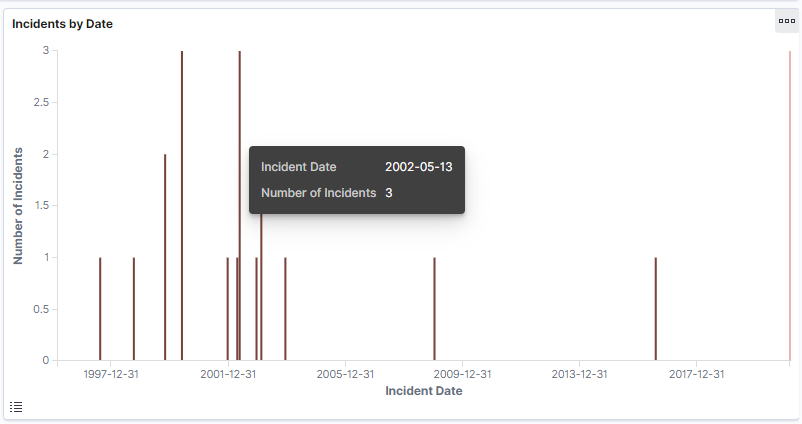
The second analytic is Incidents by Date.
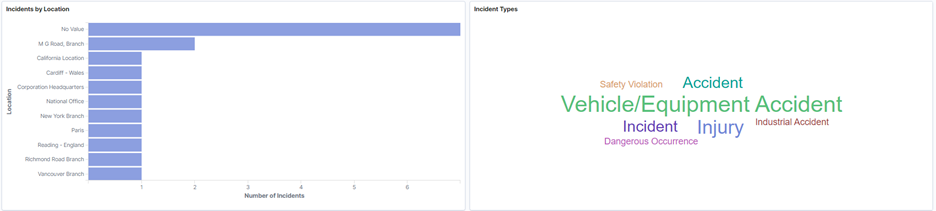
Incidents by Location is next. The larger the text in the Incident Types analytic, the more frequently that type of incident has occurred.
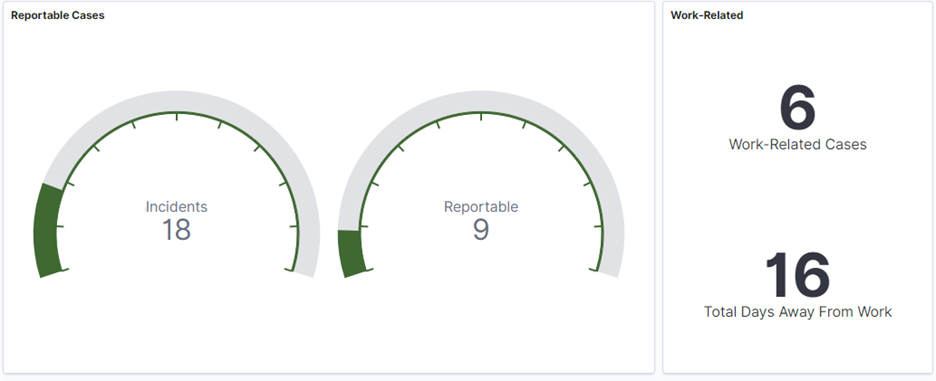
Next, we have Reportable Cases, Work-Related Cases and Total Days Away From Work.
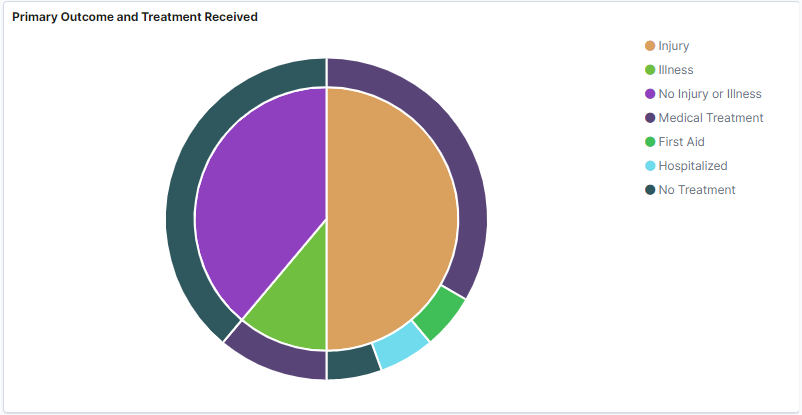
Then, we encounter the Primary Outcome and Treatment Received analytic.
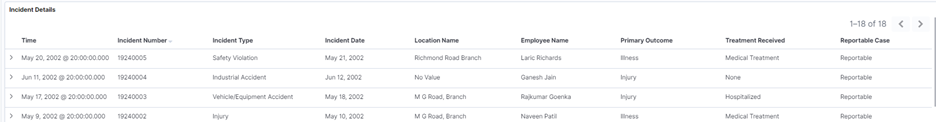
Finally, we have Incident Details which includes dates, types, names, outcomes, etc.
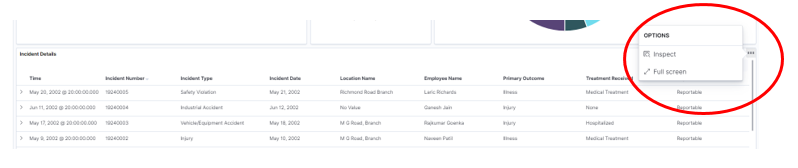
Note that all analytics can be maximized to full screen.
The Health and Safety Kibana Analytics provide an information key for tracking incidents. This information assists organizations in taking appropriate corrective actions. You can find information on PeopleSoft Health and Safety here.
If you would like more information on this topic, please reach out to me at larry.zagata@miproconsulting.com.

- Larry Zagata
- Larry Zagata
- Larry Zagata
- Larry Zagata
- Larry Zagata
- Larry Zagata
- Larry Zagata
- Larry Zagata
- Larry Zagata
- Larry Zagata
- Larry Zagata
- Larry Zagata
- Larry Zagata
- Larry Zagata
- Larry Zagata
- Larry Zagata
- Larry Zagata
- Larry Zagata
- Larry Zagata
- Larry Zagata
- Larry Zagata
- Larry Zagata
- Larry Zagata
- Larry Zagata
- Larry Zagata
- Larry Zagata
- Larry Zagata
- Larry Zagata
- Larry Zagata
- Larry Zagata
- Larry Zagata
- Larry Zagata
- Larry Zagata
- Larry Zagata
- Larry Zagata
- Larry Zagata
- Larry Zagata
- Larry Zagata
- Larry Zagata
- Larry Zagata
- Larry Zagata
- Larry Zagata
- Larry Zagata
- Larry Zagata
- Larry Zagata
- Larry Zagata
- Larry Zagata
- Larry Zagata
- Larry Zagata
- Larry Zagata
- Larry Zagata
- Larry Zagata
- Larry Zagata
- Larry Zagata
- Larry Zagata
- Larry Zagata
- Larry Zagata
- Larry Zagata
- Larry Zagata
- Larry Zagata
- Larry Zagata
- Larry Zagata
- Larry Zagata
- Larry Zagata
- Larry Zagata
- Larry Zagata
- Larry Zagata
- Larry Zagata
- Larry Zagata
- Larry Zagata
- Larry Zagata
- Larry Zagata
- Larry Zagata
- Larry Zagata
- Larry Zagata
- Larry Zagata
- Larry Zagata
- Larry Zagata
- Larry Zagata
- Larry Zagata
- Larry Zagata
- Larry Zagata
- Larry Zagata
- Larry Zagata
- Larry Zagata
- Larry Zagata
- Larry Zagata
- Larry Zagata
- Larry Zagata
- Larry Zagata
- Larry Zagata
- Larry Zagata
- Larry Zagata
- Larry Zagata
- Larry Zagata
- Larry Zagata
- Larry Zagata
- Larry Zagata
- Larry Zagata
- Larry Zagata
- Larry Zagata
- Larry Zagata
- Larry Zagata
- Larry Zagata
- Larry Zagata
- Larry Zagata
- Larry Zagata
- Larry Zagata
- Larry Zagata
- Larry Zagata
- Larry Zagata
- Larry Zagata
- Larry Zagata
- Larry Zagata
- Larry Zagata
- Larry Zagata
- Larry Zagata
- Larry Zagata
- Larry Zagata
- Larry Zagata
- Larry Zagata
- Larry Zagata
- Larry Zagata
- Larry Zagata
- Larry Zagata
- Larry Zagata
- Larry Zagata
- Larry Zagata
- Larry Zagata
- Larry Zagata
- Larry Zagata
- Larry Zagata
- Larry Zagata
- Larry Zagata
- Larry Zagata
- Larry Zagata
- Larry Zagata
- Larry Zagata
- Larry Zagata
- Larry Zagata
- Larry Zagata
- Larry Zagata
- Larry Zagata
- Larry Zagata
- Larry Zagata
- Larry Zagata
- Larry Zagata
- Larry Zagata
- Larry Zagata
- Larry Zagata
- Larry Zagata
- Larry Zagata
- Larry Zagata
- Larry Zagata
- Larry Zagata
- Larry Zagata
- Larry Zagata
- Larry Zagata
- Larry Zagata
- Larry Zagata
- Larry Zagata
- Larry Zagata
- Larry Zagata