- October 19, 2016
- Larry Zagata
- Blog
Have you heard? Simplified Analytics were delivered with PeopleTools 8.55! Simplified Analytics allow end users to create their own FLUID reports based on pre-defined templates. For the end users, it is designed to be intuitive and user friendly. In order for end users to leverage Simplified Analytics, developers or power users must enable the functionality by associating one or more pivot grid models (or base templates) to a component. That action will present the My Analytics option on the FLUID tile. See below.

Once enabled, end users can easily create new reports based on the templates available in these easy steps.
Step 1:Click on the + sign in the My Analytics tile. This will bring up the report creation process.

Give the analytics a name. Select the type of report from the options list. You have the option to choose a chart or not or use a simple table or pivot grid.
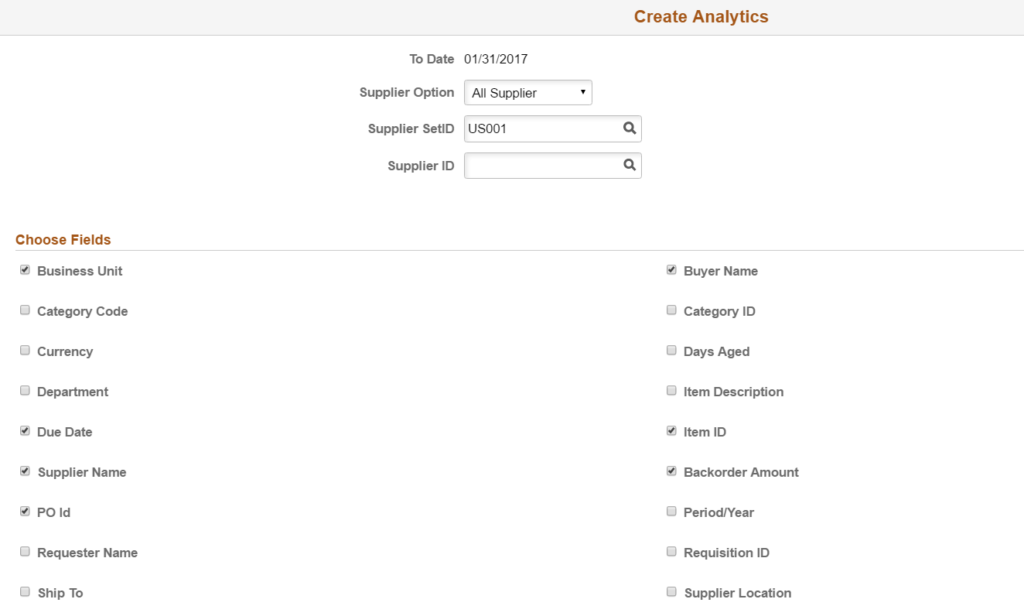
Step 2: Click Next. This provides options to choose all suppliers or specific suppliers and filter out a specific set ID and/or supplier ID. It also allows the user to choose which fields will appear in the analytics. These choices all can change depending on the template setup by the developer or power user.
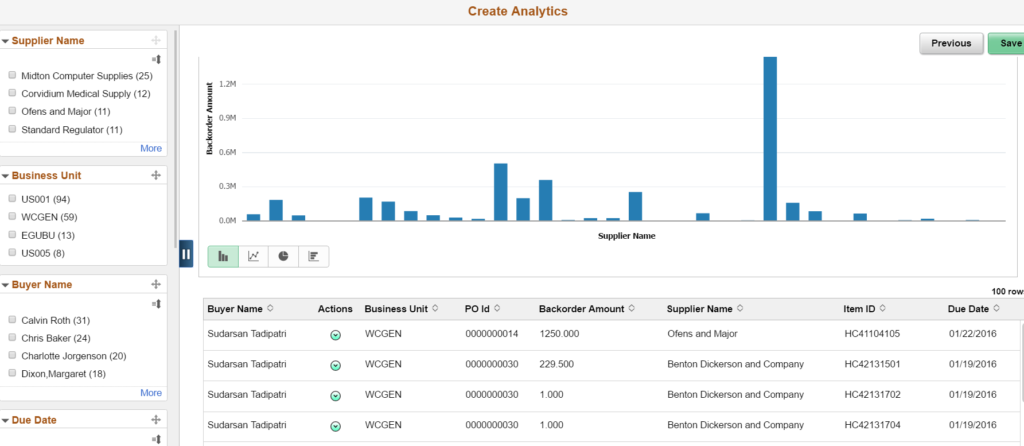
Step 3: Click Next. This will bring up the report. On the left the user can filter and the details can be drilled into at the bottom.
Step 4: Click Save and the report is available for viewing.
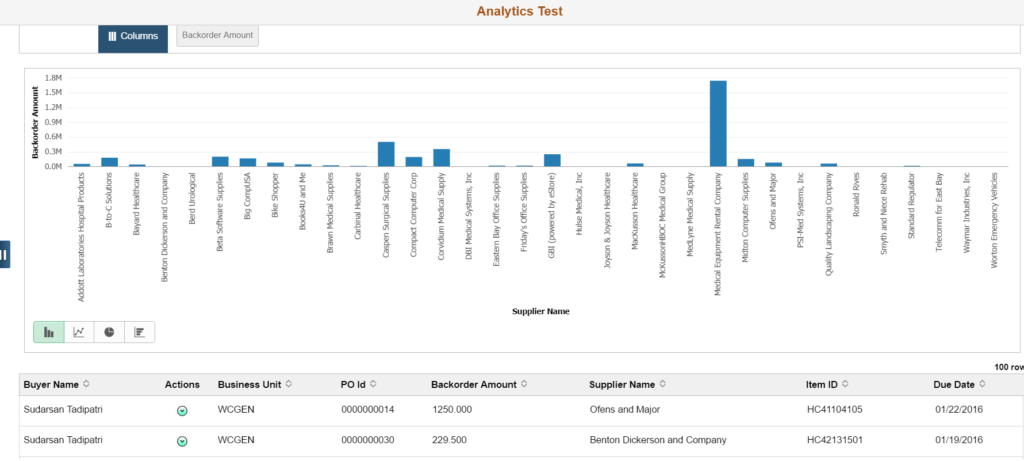
Step 5: Click on the report to show the final product.
If you would like more information on Simplified Analytics, please email me at larry.zagata@miproconsulting.com.
- Larry Zagata
- Larry Zagata
- Larry Zagata
- Larry Zagata
- Larry Zagata
- Larry Zagata
- Larry Zagata
- Larry Zagata
- Larry Zagata
- Larry Zagata
- Larry Zagata
- Larry Zagata
- Larry Zagata
- Larry Zagata
- Larry Zagata
- Larry Zagata
- Larry Zagata
- Larry Zagata
- Larry Zagata
- Larry Zagata
- Larry Zagata
- Larry Zagata
- Larry Zagata
- Larry Zagata
- Larry Zagata
- Larry Zagata
- Larry Zagata
- Larry Zagata
- Larry Zagata
- Larry Zagata
- Larry Zagata
- Larry Zagata
- Larry Zagata
- Larry Zagata
- Larry Zagata
- Larry Zagata
- Larry Zagata
- Larry Zagata
- Larry Zagata
- Larry Zagata
- Larry Zagata
- Larry Zagata
- Larry Zagata
- Larry Zagata
- Larry Zagata
- Larry Zagata
- Larry Zagata
- Larry Zagata
- Larry Zagata
- Larry Zagata
- Larry Zagata
- Larry Zagata
- Larry Zagata
- Larry Zagata
- Larry Zagata
- Larry Zagata
- Larry Zagata
- Larry Zagata
- Larry Zagata
- Larry Zagata
- Larry Zagata
- Larry Zagata
- Larry Zagata
- Larry Zagata
- Larry Zagata
- Larry Zagata
- Larry Zagata
- Larry Zagata
- Larry Zagata
- Larry Zagata
- Larry Zagata
- Larry Zagata
- Larry Zagata
- Larry Zagata
- Larry Zagata
- Larry Zagata
- Larry Zagata
- Larry Zagata
- Larry Zagata
- Larry Zagata
- Larry Zagata
- Larry Zagata
- Larry Zagata
- Larry Zagata
- Larry Zagata
- Larry Zagata
- Larry Zagata
- Larry Zagata
- Larry Zagata
- Larry Zagata
- Larry Zagata
- Larry Zagata
- Larry Zagata
- Larry Zagata
- Larry Zagata
- Larry Zagata
- Larry Zagata
- Larry Zagata
- Larry Zagata
- Larry Zagata
- Larry Zagata
- Larry Zagata
- Larry Zagata
- Larry Zagata
- Larry Zagata
- Larry Zagata
- Larry Zagata
- Larry Zagata
- Larry Zagata
- Larry Zagata
- Larry Zagata
- Larry Zagata
- Larry Zagata
- Larry Zagata
- Larry Zagata
- Larry Zagata
- Larry Zagata
- Larry Zagata
- Larry Zagata
- Larry Zagata
- Larry Zagata
- Larry Zagata
- Larry Zagata
- Larry Zagata
- Larry Zagata
- Larry Zagata
- Larry Zagata
- Larry Zagata
- Larry Zagata
- Larry Zagata
- Larry Zagata
- Larry Zagata
- Larry Zagata
- Larry Zagata
- Larry Zagata
- Larry Zagata
- Larry Zagata
- Larry Zagata
- Larry Zagata
- Larry Zagata
- Larry Zagata
- Larry Zagata
- Larry Zagata
- Larry Zagata
- Larry Zagata
- Larry Zagata
- Larry Zagata
- Larry Zagata
- Larry Zagata
- Larry Zagata
- Larry Zagata
- Larry Zagata
- Larry Zagata
- Larry Zagata
- Larry Zagata
- Larry Zagata
- Larry Zagata
- Larry Zagata
- Larry Zagata
- Larry Zagata
- Larry Zagata
- Larry Zagata
- Larry Zagata


