- September 2, 2020
- miproconsulting
- Blog
New with HCM 9.2 Image 34 are several Kibana analytics from Oracle.
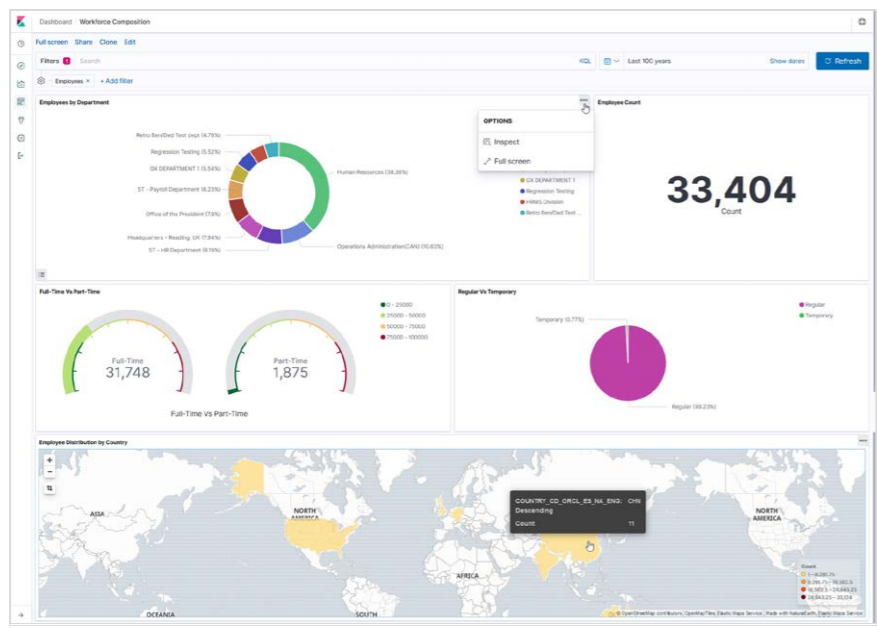
Kibana Visualizations for Workforce Composition Analytics
The Workforce Composition Dashboard enables you to view visualizations in Kibana based on the Person Index in Elasticsearch. Administrators can use the Workforce Composition Dashboard in Kibana to evaluate employee counts within their organization. Based on user privileges and criteria (such as departments and full or part-time status), administrators can analyze a subset or the entire employee workforce numbers.

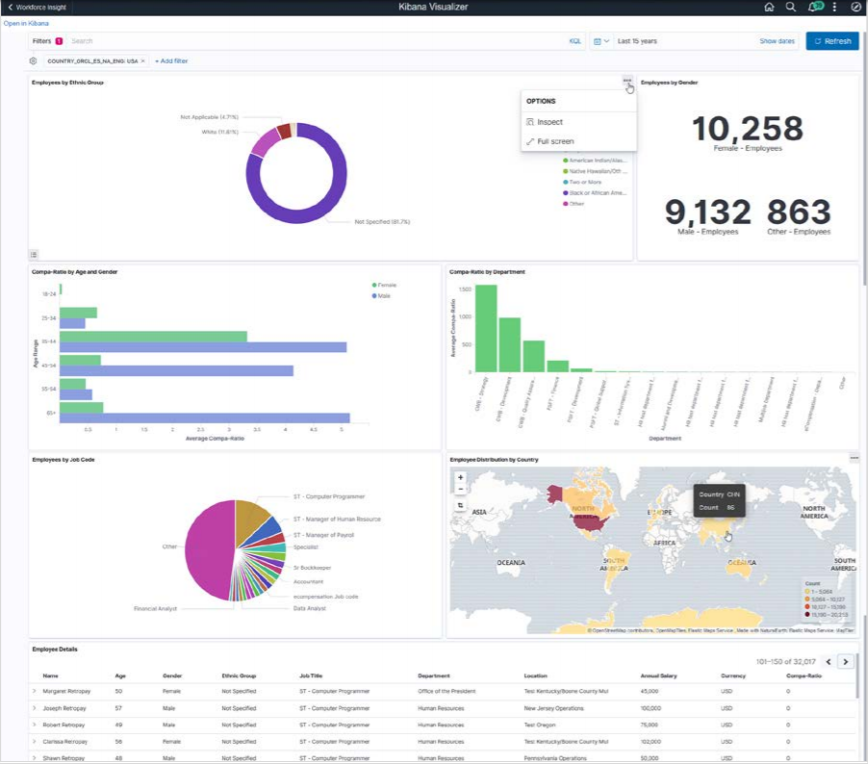
Kibana Visualizations for Workforce Equity Analytics
The Workforce Equity Dashboard enables you to view visualizations in Kibana based on the Workforce Diversity Elastic Search Index. Administrators can use the Workforce Equity Dashboard to evaluate workforce equity data. Based on their user privileges and criteria (i.e. gender and ethnicity), administrators can analyze diversity and compensation for the entire workforce or for a subset of the organization. From the visualization, you can filter down to view more specific equity data within your organization.

For more information on PeopleSoft HCM/ELM Update Image Overview: Images 22-34 and ELM Update Images 16-20, click here.
If you would like any additional information on Simplified Analytics, contact me at larry.zagata@miproconsulting.com.
- miproconsulting
- miproconsulting
- miproconsulting
- miproconsulting
- miproconsulting
- miproconsulting
- miproconsulting
- miproconsulting
- miproconsulting
- miproconsulting
- miproconsulting
- miproconsulting
- miproconsulting
- miproconsulting
- miproconsulting
- miproconsulting
- miproconsulting
- miproconsulting
- miproconsulting
- miproconsulting
- miproconsulting
- miproconsulting
- miproconsulting
- miproconsulting
- miproconsulting
- miproconsulting
- miproconsulting
- miproconsulting
- miproconsulting
- miproconsulting
- miproconsulting
- miproconsulting
- miproconsulting
- miproconsulting
- miproconsulting
- miproconsulting
- miproconsulting
- miproconsulting
- miproconsulting
- miproconsulting
- miproconsulting
- miproconsulting
- miproconsulting
- miproconsulting
- miproconsulting
- miproconsulting
- miproconsulting
- miproconsulting
- miproconsulting
- miproconsulting
- miproconsulting
- miproconsulting
- miproconsulting
- miproconsulting
- miproconsulting
- miproconsulting
- miproconsulting
- miproconsulting
- miproconsulting
- miproconsulting
- miproconsulting
- miproconsulting
- miproconsulting
- miproconsulting
- miproconsulting
- miproconsulting
- miproconsulting
- miproconsulting
- miproconsulting
- miproconsulting
- miproconsulting
- miproconsulting
- miproconsulting
- miproconsulting
- miproconsulting
- miproconsulting
- miproconsulting
- miproconsulting
- miproconsulting
- miproconsulting
- miproconsulting
- miproconsulting
- miproconsulting
- miproconsulting
- miproconsulting
- miproconsulting
- miproconsulting
- miproconsulting
- miproconsulting
- miproconsulting
- miproconsulting
- miproconsulting
- miproconsulting
- miproconsulting
- miproconsulting
- miproconsulting
- miproconsulting
- miproconsulting
- miproconsulting
- miproconsulting
- miproconsulting
- miproconsulting
- miproconsulting
- miproconsulting
- miproconsulting
- miproconsulting
- miproconsulting
- miproconsulting
- miproconsulting
- miproconsulting
- miproconsulting
- miproconsulting
- miproconsulting
- miproconsulting
- miproconsulting
- miproconsulting
- miproconsulting
- miproconsulting
- miproconsulting
- miproconsulting
- miproconsulting
- miproconsulting
- miproconsulting
- miproconsulting
- miproconsulting
- miproconsulting
- miproconsulting
- miproconsulting
- miproconsulting
- miproconsulting
- miproconsulting
- miproconsulting
- miproconsulting
- miproconsulting
- miproconsulting
- miproconsulting
- miproconsulting
- miproconsulting
- miproconsulting
- miproconsulting
- miproconsulting
- miproconsulting
- miproconsulting
- miproconsulting
- miproconsulting
- miproconsulting
- miproconsulting
- miproconsulting
- miproconsulting
- miproconsulting
- miproconsulting
- miproconsulting
- miproconsulting
- miproconsulting
- miproconsulting
- miproconsulting
- miproconsulting
- miproconsulting
- miproconsulting
- miproconsulting
- miproconsulting
- miproconsulting
- miproconsulting
- miproconsulting
- miproconsulting
- miproconsulting
- miproconsulting
- miproconsulting
- miproconsulting
- miproconsulting
- miproconsulting
- miproconsulting
- miproconsulting
- miproconsulting
- miproconsulting
- miproconsulting
- miproconsulting
- miproconsulting
- miproconsulting
- miproconsulting
- miproconsulting
- miproconsulting
- miproconsulting
- miproconsulting
- miproconsulting
- miproconsulting
- miproconsulting
- miproconsulting
- miproconsulting
- miproconsulting
- miproconsulting
- miproconsulting
- miproconsulting
- miproconsulting
- miproconsulting
- miproconsulting
- miproconsulting
- miproconsulting
- miproconsulting
- miproconsulting
- miproconsulting
- miproconsulting
- miproconsulting
- miproconsulting
- miproconsulting
- miproconsulting
- miproconsulting
- miproconsulting
- miproconsulting
- miproconsulting
- miproconsulting
- miproconsulting
- miproconsulting
- miproconsulting
- miproconsulting
- miproconsulting
- miproconsulting
- miproconsulting
- miproconsulting
- miproconsulting
- miproconsulting
- miproconsulting
- miproconsulting
- miproconsulting
- miproconsulting
- miproconsulting
- miproconsulting
- miproconsulting
- miproconsulting
- miproconsulting
- miproconsulting
- miproconsulting
- miproconsulting
- miproconsulting
- miproconsulting
- miproconsulting
- miproconsulting
- miproconsulting
- miproconsulting
- miproconsulting
- miproconsulting
- miproconsulting
- miproconsulting
- miproconsulting
- miproconsulting
- miproconsulting
- miproconsulting
- miproconsulting
- miproconsulting
- miproconsulting
- miproconsulting
- miproconsulting
- miproconsulting
- miproconsulting
- miproconsulting
- miproconsulting
- miproconsulting
- miproconsulting
- miproconsulting
- miproconsulting
- miproconsulting
- miproconsulting
- miproconsulting
- miproconsulting
- miproconsulting
- miproconsulting
- miproconsulting
- miproconsulting
- miproconsulting
- miproconsulting
- miproconsulting
- miproconsulting
- miproconsulting
- miproconsulting
- miproconsulting
- miproconsulting
- miproconsulting
- miproconsulting
- miproconsulting
- miproconsulting
- miproconsulting
- miproconsulting
- miproconsulting
- miproconsulting
- miproconsulting
- miproconsulting
- miproconsulting
- miproconsulting
- miproconsulting
- miproconsulting
- miproconsulting
- miproconsulting
- miproconsulting
- miproconsulting
- miproconsulting
- miproconsulting
- miproconsulting
- miproconsulting
- miproconsulting
- miproconsulting
- miproconsulting
- miproconsulting
- miproconsulting
- miproconsulting
- miproconsulting
- miproconsulting
- miproconsulting
- miproconsulting
- miproconsulting
- miproconsulting
- miproconsulting
- miproconsulting
- miproconsulting
- miproconsulting
- miproconsulting
- miproconsulting
- miproconsulting
- miproconsulting
- miproconsulting
- miproconsulting
- miproconsulting
- miproconsulting
- miproconsulting
- miproconsulting
- miproconsulting
- miproconsulting
- miproconsulting
- miproconsulting
- miproconsulting
- miproconsulting
- miproconsulting
- miproconsulting
- miproconsulting
- miproconsulting
- miproconsulting
- miproconsulting
- miproconsulting
- miproconsulting
- miproconsulting
- miproconsulting
- miproconsulting
- miproconsulting
- miproconsulting
- miproconsulting
- miproconsulting
- miproconsulting
- miproconsulting
- miproconsulting
- miproconsulting
- miproconsulting
- miproconsulting
- miproconsulting
- miproconsulting
- miproconsulting
- miproconsulting
- miproconsulting
- miproconsulting
- miproconsulting
- miproconsulting
- miproconsulting
- miproconsulting
- miproconsulting
- miproconsulting
- miproconsulting
- miproconsulting
- miproconsulting
- miproconsulting
- miproconsulting
- miproconsulting
- miproconsulting
- miproconsulting
- miproconsulting
- miproconsulting
- miproconsulting
- miproconsulting
- miproconsulting
- miproconsulting
- miproconsulting
- miproconsulting
- miproconsulting
- miproconsulting
- miproconsulting
- miproconsulting
- miproconsulting
- miproconsulting
- miproconsulting
- miproconsulting
- miproconsulting
- miproconsulting
- miproconsulting
- miproconsulting
- miproconsulting
- miproconsulting
- miproconsulting
- miproconsulting
- miproconsulting
- miproconsulting
- miproconsulting
- miproconsulting
- miproconsulting
- miproconsulting
- miproconsulting
- miproconsulting
- miproconsulting
- miproconsulting
- miproconsulting
- miproconsulting
- miproconsulting
- miproconsulting
- miproconsulting
- miproconsulting
- miproconsulting
- miproconsulting
- miproconsulting
- miproconsulting
- miproconsulting
- miproconsulting
- miproconsulting
- miproconsulting
- miproconsulting
- miproconsulting
- miproconsulting
- miproconsulting
- miproconsulting
- miproconsulting
- miproconsulting
- miproconsulting
- miproconsulting
- miproconsulting
- miproconsulting
- miproconsulting
- miproconsulting
- miproconsulting
- miproconsulting
- miproconsulting
- miproconsulting
- miproconsulting
- miproconsulting
- miproconsulting
- miproconsulting
- miproconsulting
- miproconsulting
- miproconsulting
- miproconsulting
- miproconsulting
- miproconsulting
- miproconsulting
- miproconsulting
- miproconsulting
- miproconsulting
- miproconsulting
- miproconsulting
- miproconsulting
- miproconsulting
- miproconsulting
- miproconsulting
- miproconsulting
- miproconsulting
- miproconsulting
- miproconsulting
- miproconsulting
- miproconsulting
- miproconsulting
- miproconsulting
- miproconsulting
- miproconsulting
- miproconsulting
- miproconsulting
- miproconsulting
- miproconsulting
- miproconsulting
- miproconsulting
- miproconsulting
- miproconsulting
- miproconsulting
- miproconsulting
- miproconsulting
- miproconsulting
- miproconsulting
- miproconsulting
- miproconsulting
- miproconsulting
- miproconsulting
- miproconsulting
- miproconsulting
- miproconsulting
- miproconsulting
- miproconsulting
- miproconsulting
- miproconsulting
- miproconsulting
- miproconsulting
- miproconsulting
- miproconsulting
- miproconsulting
- miproconsulting
- miproconsulting
- miproconsulting
- miproconsulting
- miproconsulting
- miproconsulting
- miproconsulting
- miproconsulting
- miproconsulting
- miproconsulting
- miproconsulting
- miproconsulting
- miproconsulting
- miproconsulting
- miproconsulting
- miproconsulting
- miproconsulting
- miproconsulting
- miproconsulting
- miproconsulting
- miproconsulting
- miproconsulting
- miproconsulting
- miproconsulting
- miproconsulting
- miproconsulting
- miproconsulting
- miproconsulting
- miproconsulting
- miproconsulting
- miproconsulting
- miproconsulting
- miproconsulting
- miproconsulting
- miproconsulting
- miproconsulting
- miproconsulting
- miproconsulting
- miproconsulting
- miproconsulting
- miproconsulting
- miproconsulting
- miproconsulting
- miproconsulting
- miproconsulting
- miproconsulting
- miproconsulting
- miproconsulting
- miproconsulting
- miproconsulting
- miproconsulting
- miproconsulting
- miproconsulting
- miproconsulting
- miproconsulting
- miproconsulting
- miproconsulting
- miproconsulting
- miproconsulting
- miproconsulting
- miproconsulting
- miproconsulting
- miproconsulting
- miproconsulting
- miproconsulting
- miproconsulting
- miproconsulting
- miproconsulting
- miproconsulting
- miproconsulting
- miproconsulting
- miproconsulting
- miproconsulting
- miproconsulting
- miproconsulting
- miproconsulting
- miproconsulting
- miproconsulting
- miproconsulting
- miproconsulting
- miproconsulting
- miproconsulting
- miproconsulting
- miproconsulting
- miproconsulting
- miproconsulting
- miproconsulting
- miproconsulting
- miproconsulting
- miproconsulting
- miproconsulting
- miproconsulting
- miproconsulting
- miproconsulting
- miproconsulting
- miproconsulting
- miproconsulting
- miproconsulting
- miproconsulting
- miproconsulting
- miproconsulting
- miproconsulting
- miproconsulting
- miproconsulting
- miproconsulting
- miproconsulting
- miproconsulting
- miproconsulting
- miproconsulting
- miproconsulting
- miproconsulting
- miproconsulting
- miproconsulting
- miproconsulting
- miproconsulting
- miproconsulting
- miproconsulting
- miproconsulting
- miproconsulting
- miproconsulting
- miproconsulting
- miproconsulting
- miproconsulting
- miproconsulting
- miproconsulting
- miproconsulting
- miproconsulting
- miproconsulting
- miproconsulting
- miproconsulting
- miproconsulting
- miproconsulting
- miproconsulting
- miproconsulting
- miproconsulting
- miproconsulting
- miproconsulting
- miproconsulting
- miproconsulting
- miproconsulting
- miproconsulting
- miproconsulting
- miproconsulting
- miproconsulting
- miproconsulting
- miproconsulting
- miproconsulting
- miproconsulting
- miproconsulting
- miproconsulting
- miproconsulting
- miproconsulting
- miproconsulting
- miproconsulting
- miproconsulting
- miproconsulting
- miproconsulting
- miproconsulting
- miproconsulting
- miproconsulting
- miproconsulting
- miproconsulting
- miproconsulting
- miproconsulting
- miproconsulting
- miproconsulting
- miproconsulting
- miproconsulting
- miproconsulting
- miproconsulting
- miproconsulting
- miproconsulting
- miproconsulting
- miproconsulting
- miproconsulting
- miproconsulting
- miproconsulting
- miproconsulting
- miproconsulting
- miproconsulting
- miproconsulting
- miproconsulting
- miproconsulting
- miproconsulting
- miproconsulting
- miproconsulting
- miproconsulting
- miproconsulting
- miproconsulting
- miproconsulting
- miproconsulting
- miproconsulting
- miproconsulting
- miproconsulting
- miproconsulting
- miproconsulting

