- March 17, 2020
- Larry Zagata
- Blog
In Part II of our BI Publisher blog series, we will demonstrate how to make a functional and presentable report by leveraging Word.
- To add a header to the top of the report, open the header. Then, cut and paste the header into the report.
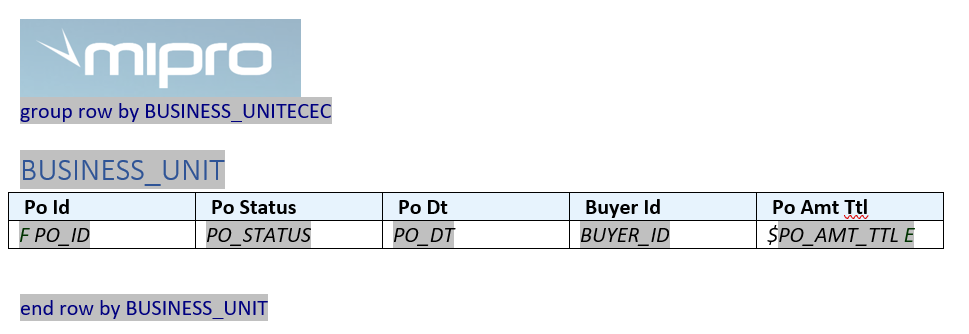
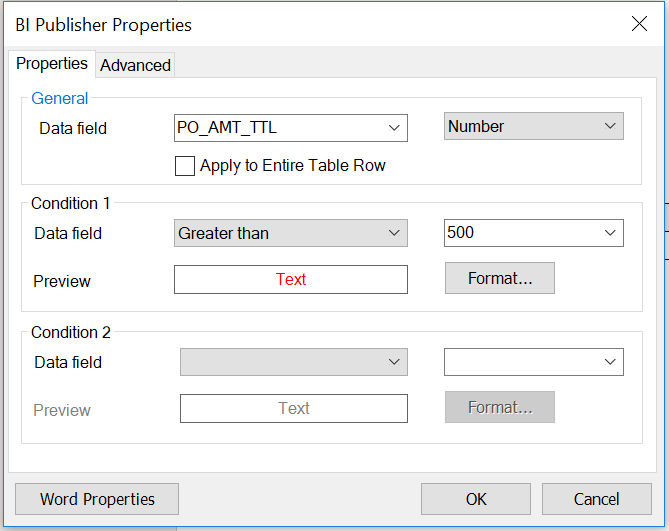
- To add conditional formatting, go to the BI Publisher tab and click on Conditional Format.

In this example, we selected PO Amt Ttl for the Data field. Then, we selected Greater than 500 for Condition 1. In this case, we chose red for any amount greater than $500.
- To change the font, we used the ribbon in Word to adjust the font to Calibri 10.
- To add a chart, you have two options. You can either add one at the top in order to total everything, or you can add a chart within each grouping that you set up.

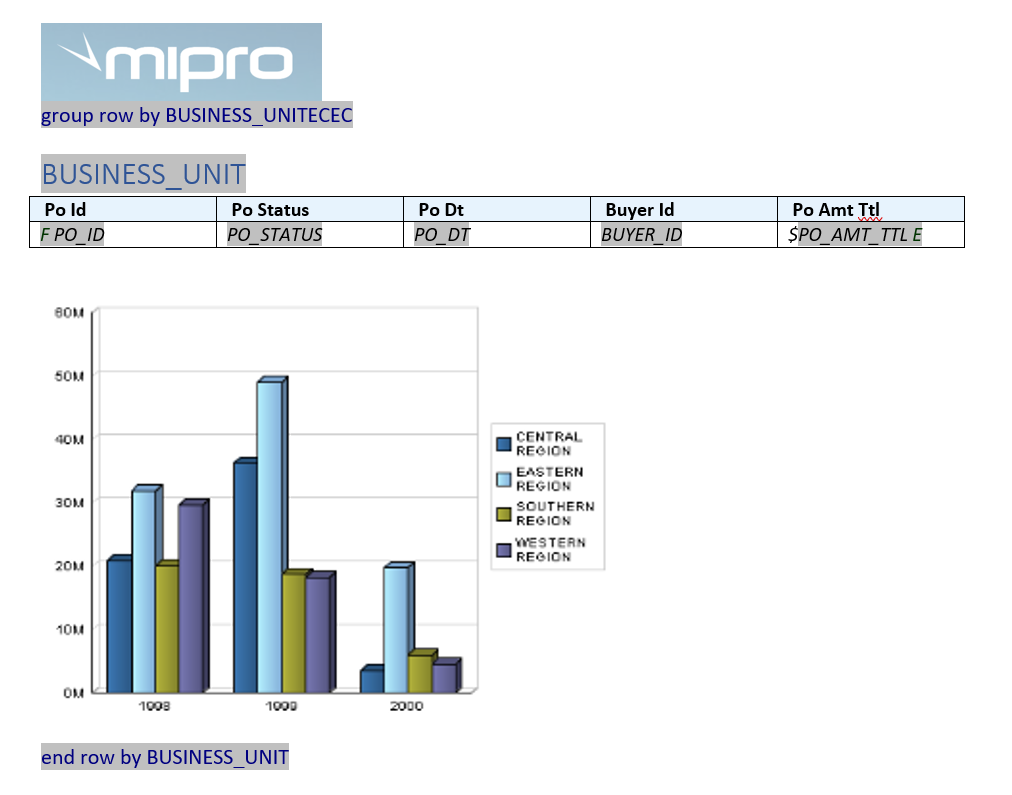
Once the Chart Wizard opened, we dragged the PO Amt Ttl into the Values field in the Layout. Next, we dragged the Buyer Id into the Labels field and then clicked on “Chart is inside group”. In this example, the chart will repeat and only use the data within each grouping.

Here is a view of our report template.
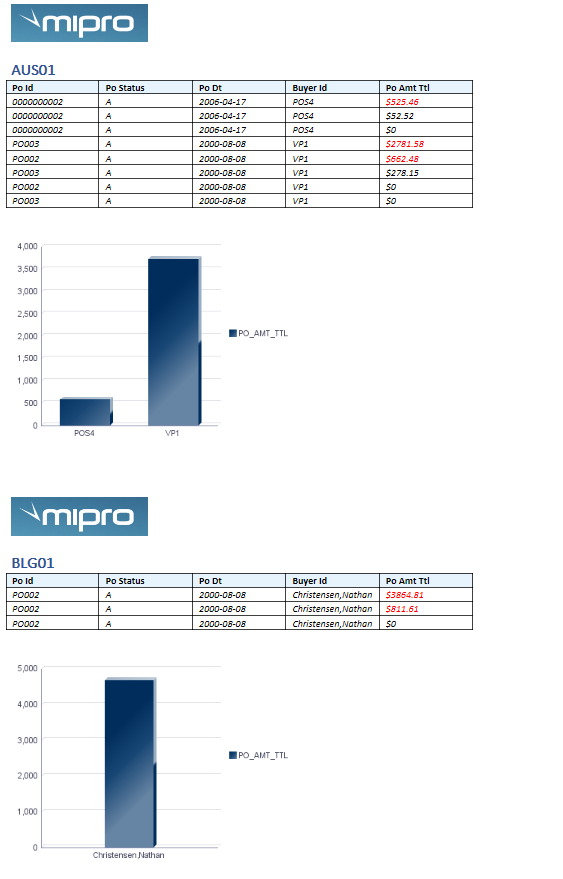
Here is a view of our actual report which includes the header, the conditional formatting of red text over $500, the new font and the chart totaling the PO amount by Buyer Id.
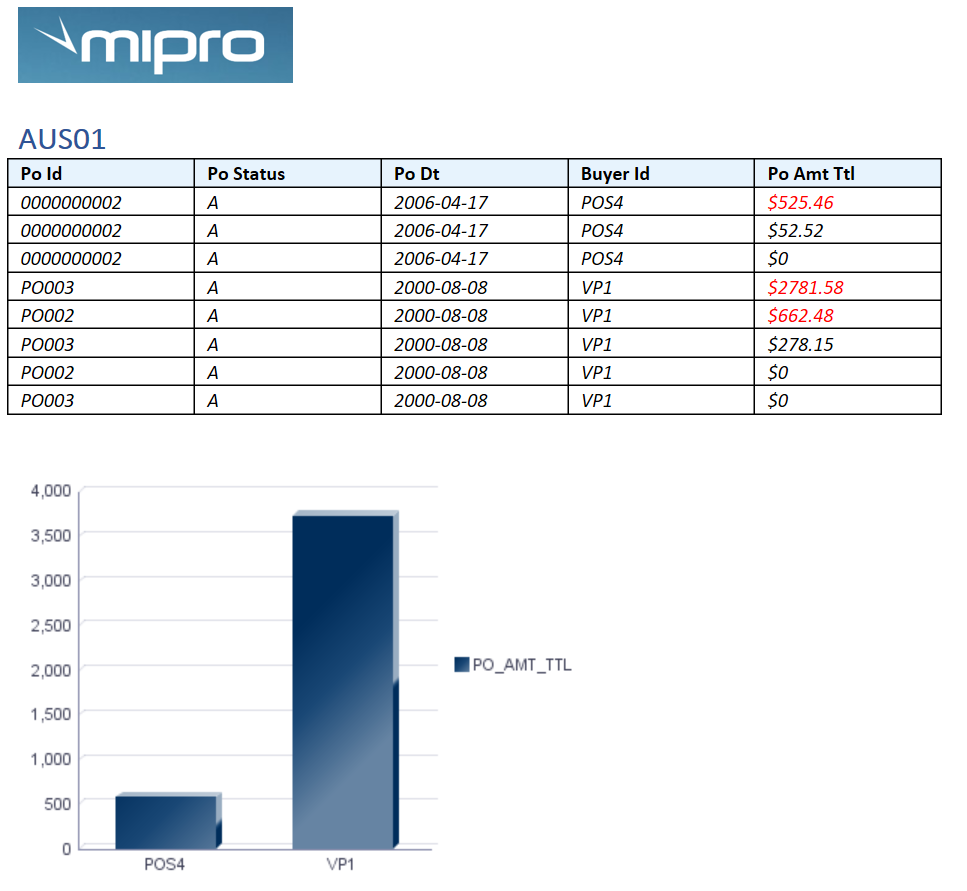
A wider view of the report shows it repeating by business unit.
These are just a few things you can do to improve and personalize your BI Publisher reports.
As always, if you have any questions or need any additional information, please email me at Larry.zagata@miproconsulting.com. To read more about MIPRO Consulting, click here.
- Larry Zagata
- Larry Zagata
- Larry Zagata
- Larry Zagata
- Larry Zagata
- Larry Zagata
- Larry Zagata
- Larry Zagata
- Larry Zagata
- Larry Zagata
- Larry Zagata
- Larry Zagata
- Larry Zagata
- Larry Zagata
- Larry Zagata
- Larry Zagata
- Larry Zagata
- Larry Zagata
- Larry Zagata
- Larry Zagata
- Larry Zagata
- Larry Zagata
- Larry Zagata
- Larry Zagata
- Larry Zagata
- Larry Zagata
- Larry Zagata
- Larry Zagata
- Larry Zagata
- Larry Zagata
- Larry Zagata
- Larry Zagata
- Larry Zagata
- Larry Zagata
- Larry Zagata
- Larry Zagata
- Larry Zagata
- Larry Zagata
- Larry Zagata
- Larry Zagata
- Larry Zagata
- Larry Zagata
- Larry Zagata
- Larry Zagata
- Larry Zagata
- Larry Zagata
- Larry Zagata
- Larry Zagata
- Larry Zagata
- Larry Zagata
- Larry Zagata
- Larry Zagata
- Larry Zagata
- Larry Zagata
- Larry Zagata
- Larry Zagata
- Larry Zagata
- Larry Zagata
- Larry Zagata
- Larry Zagata
- Larry Zagata
- Larry Zagata
- Larry Zagata
- Larry Zagata
- Larry Zagata
- Larry Zagata
- Larry Zagata
- Larry Zagata
- Larry Zagata
- Larry Zagata
- Larry Zagata
- Larry Zagata
- Larry Zagata
- Larry Zagata
- Larry Zagata
- Larry Zagata
- Larry Zagata
- Larry Zagata
- Larry Zagata
- Larry Zagata
- Larry Zagata
- Larry Zagata
- Larry Zagata
- Larry Zagata
- Larry Zagata
- Larry Zagata
- Larry Zagata
- Larry Zagata
- Larry Zagata
- Larry Zagata
- Larry Zagata
- Larry Zagata
- Larry Zagata
- Larry Zagata
- Larry Zagata
- Larry Zagata
- Larry Zagata
- Larry Zagata
- Larry Zagata
- Larry Zagata
- Larry Zagata
- Larry Zagata
- Larry Zagata
- Larry Zagata
- Larry Zagata
- Larry Zagata
- Larry Zagata
- Larry Zagata
- Larry Zagata
- Larry Zagata
- Larry Zagata
- Larry Zagata
- Larry Zagata
- Larry Zagata
- Larry Zagata
- Larry Zagata
- Larry Zagata
- Larry Zagata
- Larry Zagata
- Larry Zagata
- Larry Zagata
- Larry Zagata
- Larry Zagata
- Larry Zagata
- Larry Zagata
- Larry Zagata
- Larry Zagata
- Larry Zagata
- Larry Zagata
- Larry Zagata
- Larry Zagata
- Larry Zagata
- Larry Zagata
- Larry Zagata
- Larry Zagata
- Larry Zagata
- Larry Zagata
- Larry Zagata
- Larry Zagata
- Larry Zagata
- Larry Zagata
- Larry Zagata
- Larry Zagata
- Larry Zagata
- Larry Zagata
- Larry Zagata
- Larry Zagata
- Larry Zagata
- Larry Zagata
- Larry Zagata
- Larry Zagata
- Larry Zagata
- Larry Zagata
- Larry Zagata
- Larry Zagata
- Larry Zagata
- Larry Zagata
- Larry Zagata
- Larry Zagata
- Larry Zagata
- Larry Zagata
- Larry Zagata
- Larry Zagata


