
- January 30, 2018
- Larry Zagata
- Blog
Many of the Manager Self-Service Fluid Pages now include a slide out supplementary panel which includes My Analytics. This function is new in Image 21, using PeopleTools 8.55 functionality or higher. The panel provides related information and insight to help managers complete their transactions. Managers can use the My Analytics tab to create their own personalized analytics. We are going to take this opportunity to show how managers can quickly and easily create My Analytics charts, tables, or pivot grids. If you missed our past blog about simplified analytics click here to learn more.
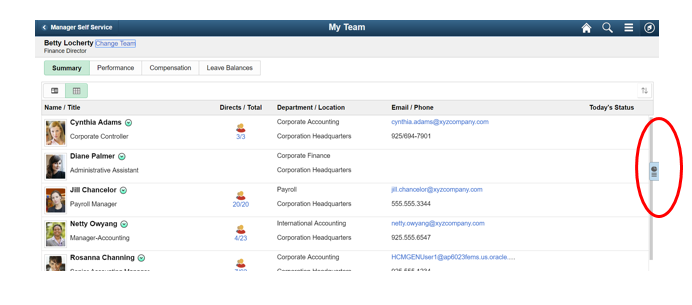
We’ll use the My Team page as an example. Once in the Fluid My Team Page, users will see on the far right the supplementary panel that they can expose by clicking on it.
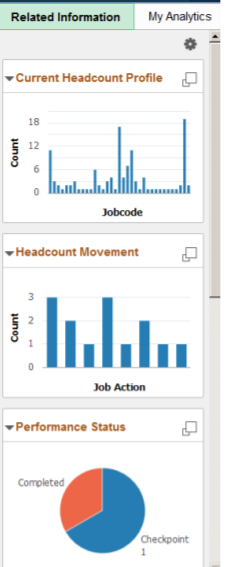
Below is the exposed panel with the supplementary information. Notice the two tabs, Related Information and My Analytics.
Below is the exposed panel with the supplementary information. Notice the two tabs, Related Information and My Analytics.
Clicking on the My Analytics tab will display any analytics that the user created. Let’s do a quick walk through of creating an analytic.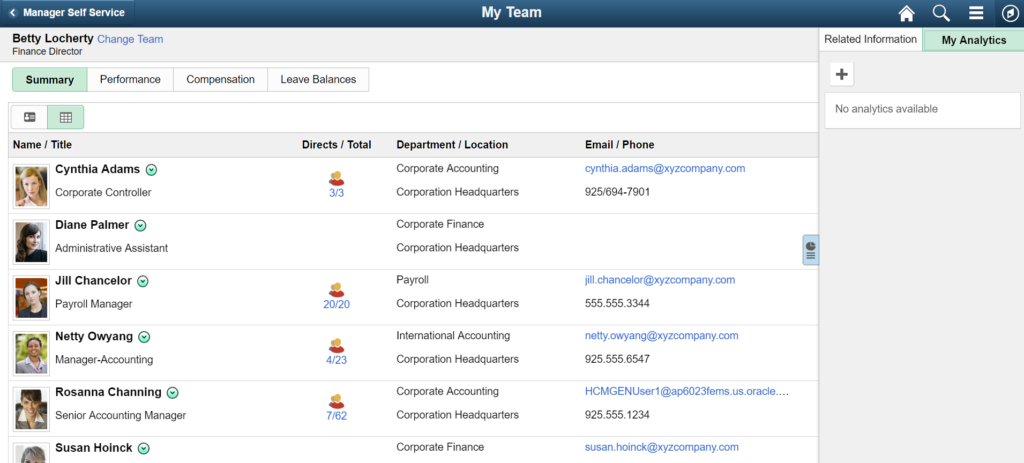
Step 1: Click on the + symbol to bring up the create analytics page. You will need to provide a name for your analytic and choose the option for chart, table or pivot grid. In this example, we will use a simple table.
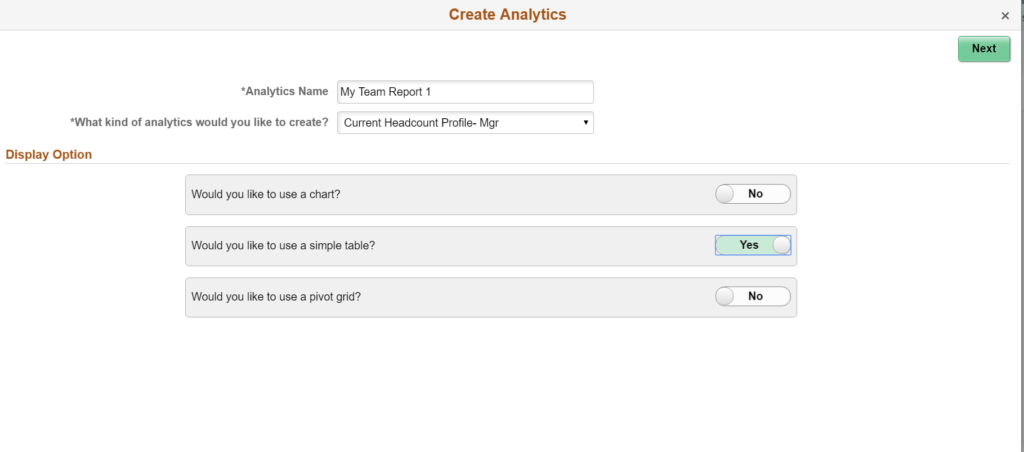
Step 2: Select which fields will be in your table.
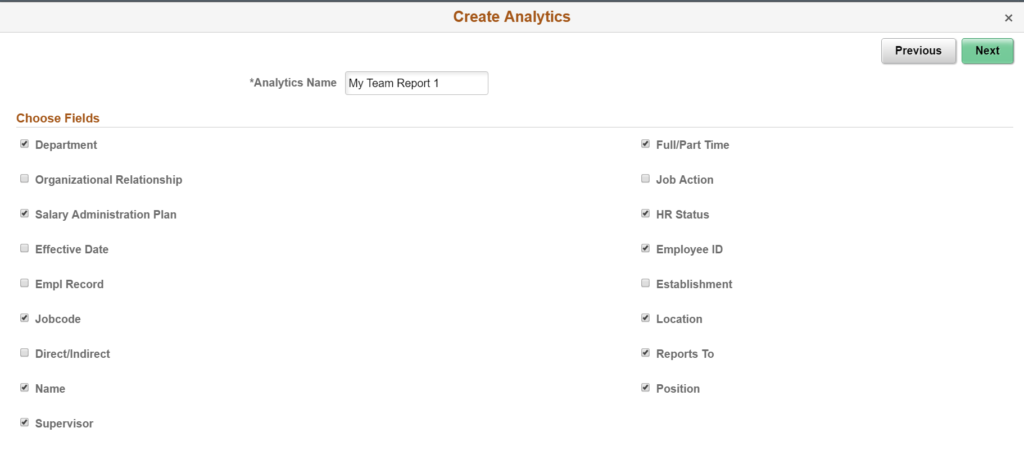
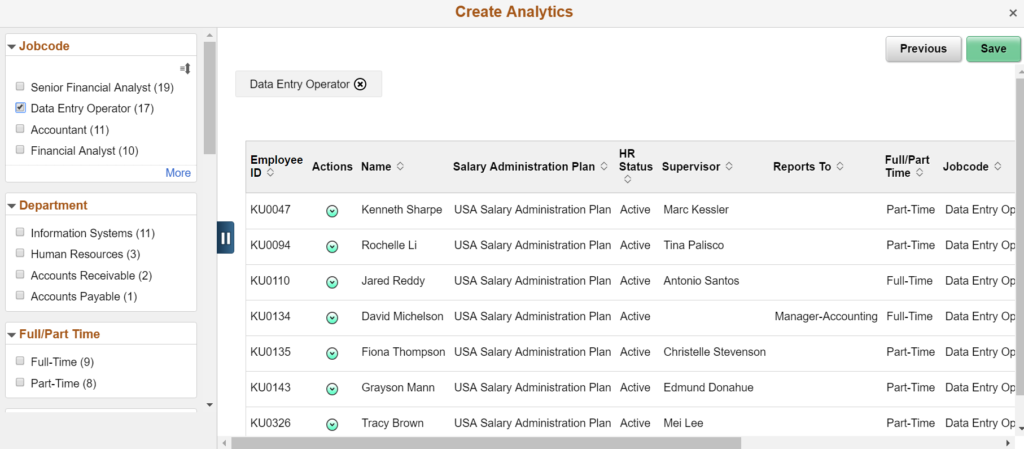
Step 3: Setup any filters that you want for your report. You can filter by job code, department, full/part time, etc. Essentially, filter by any of the fields you had options for in step 2.
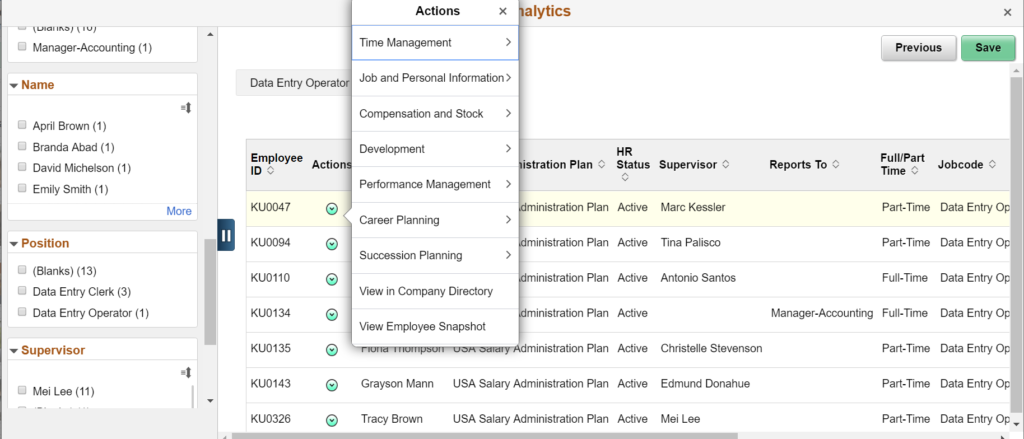
You can also see the available related actions that are part of the analytic report.
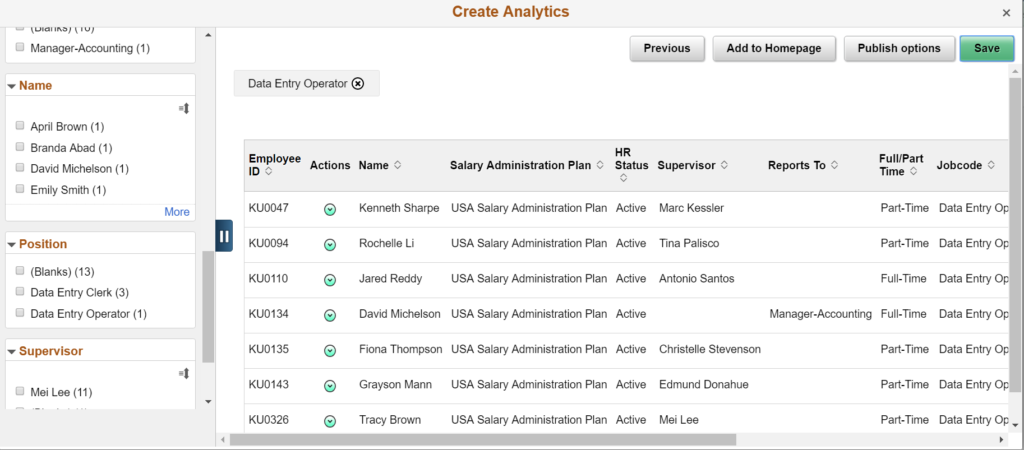
Once saved you can add this to any homepage or publish it for use for other users.

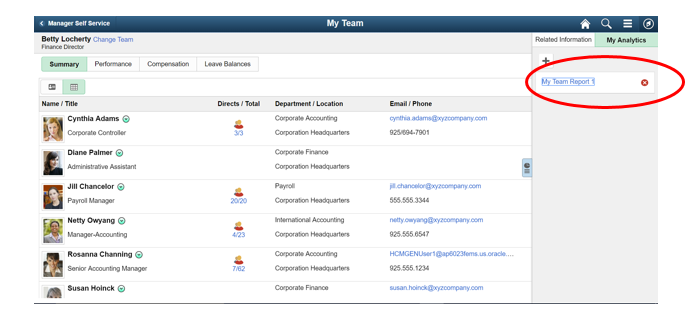
Once saved, the user will see the report available under their My Analytics tab.
If you would like additional information, please contact me at Larry.Zagata@MIPROConsulting.com.
- Larry Zagata
- Larry Zagata
- Larry Zagata
- Larry Zagata
- Larry Zagata
- Larry Zagata
- Larry Zagata
- Larry Zagata
- Larry Zagata
- Larry Zagata
- Larry Zagata
- Larry Zagata
- Larry Zagata
- Larry Zagata
- Larry Zagata
- Larry Zagata
- Larry Zagata
- Larry Zagata
- Larry Zagata
- Larry Zagata
- Larry Zagata
- Larry Zagata
- Larry Zagata
- Larry Zagata
- Larry Zagata
- Larry Zagata
- Larry Zagata
- Larry Zagata
- Larry Zagata
- Larry Zagata
- Larry Zagata
- Larry Zagata
- Larry Zagata
- Larry Zagata
- Larry Zagata
- Larry Zagata
- Larry Zagata
- Larry Zagata
- Larry Zagata
- Larry Zagata
- Larry Zagata
- Larry Zagata
- Larry Zagata
- Larry Zagata
- Larry Zagata
- Larry Zagata
- Larry Zagata
- Larry Zagata
- Larry Zagata
- Larry Zagata
- Larry Zagata
- Larry Zagata
- Larry Zagata
- Larry Zagata
- Larry Zagata
- Larry Zagata
- Larry Zagata
- Larry Zagata
- Larry Zagata
- Larry Zagata
- Larry Zagata
- Larry Zagata
- Larry Zagata
- Larry Zagata
- Larry Zagata
- Larry Zagata
- Larry Zagata
- Larry Zagata
- Larry Zagata
- Larry Zagata
- Larry Zagata
- Larry Zagata
- Larry Zagata
- Larry Zagata
- Larry Zagata
- Larry Zagata
- Larry Zagata
- Larry Zagata
- Larry Zagata
- Larry Zagata
- Larry Zagata
- Larry Zagata
- Larry Zagata
- Larry Zagata
- Larry Zagata
- Larry Zagata
- Larry Zagata
- Larry Zagata
- Larry Zagata
- Larry Zagata
- Larry Zagata
- Larry Zagata
- Larry Zagata
- Larry Zagata
- Larry Zagata
- Larry Zagata
- Larry Zagata
- Larry Zagata
- Larry Zagata
- Larry Zagata
- Larry Zagata
- Larry Zagata
- Larry Zagata
- Larry Zagata
- Larry Zagata
- Larry Zagata
- Larry Zagata
- Larry Zagata
- Larry Zagata
- Larry Zagata
- Larry Zagata
- Larry Zagata
- Larry Zagata
- Larry Zagata
- Larry Zagata
- Larry Zagata
- Larry Zagata
- Larry Zagata
- Larry Zagata
- Larry Zagata
- Larry Zagata
- Larry Zagata
- Larry Zagata
- Larry Zagata
- Larry Zagata
- Larry Zagata
- Larry Zagata
- Larry Zagata
- Larry Zagata
- Larry Zagata
- Larry Zagata
- Larry Zagata
- Larry Zagata
- Larry Zagata
- Larry Zagata
- Larry Zagata
- Larry Zagata
- Larry Zagata
- Larry Zagata
- Larry Zagata
- Larry Zagata
- Larry Zagata
- Larry Zagata
- Larry Zagata
- Larry Zagata
- Larry Zagata
- Larry Zagata
- Larry Zagata
- Larry Zagata
- Larry Zagata
- Larry Zagata
- Larry Zagata
- Larry Zagata
- Larry Zagata
- Larry Zagata
- Larry Zagata
- Larry Zagata
- Larry Zagata
- Larry Zagata
- Larry Zagata
- Larry Zagata
- Larry Zagata
- Larry Zagata

