Delivered with PeopleSoft FSCM PUM Updates 43-45 are new analytics, both Kibana and PeopleSoft Dashboard/Pagelets. Here is a summary of those analytics.
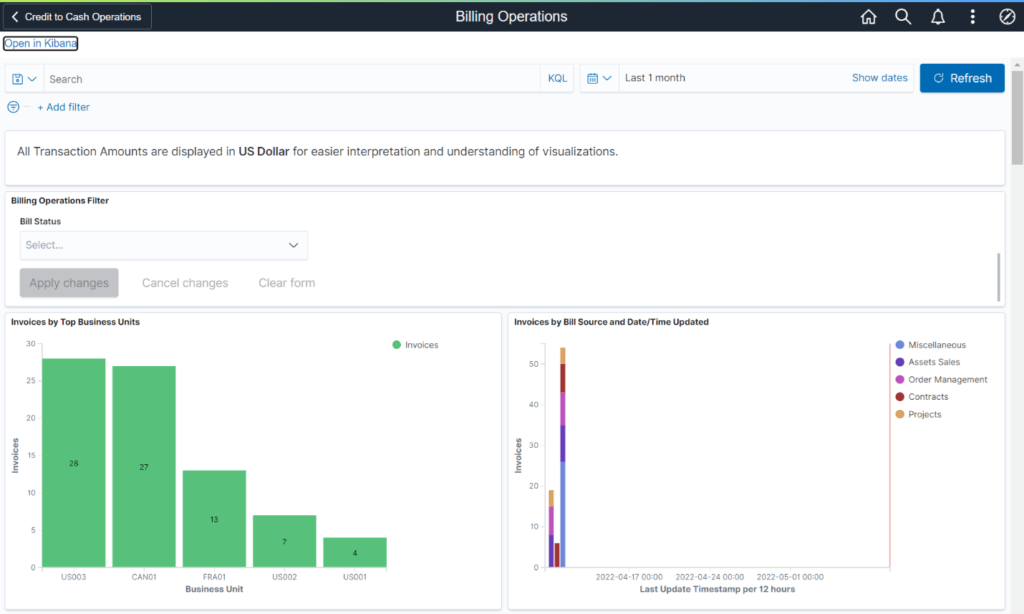
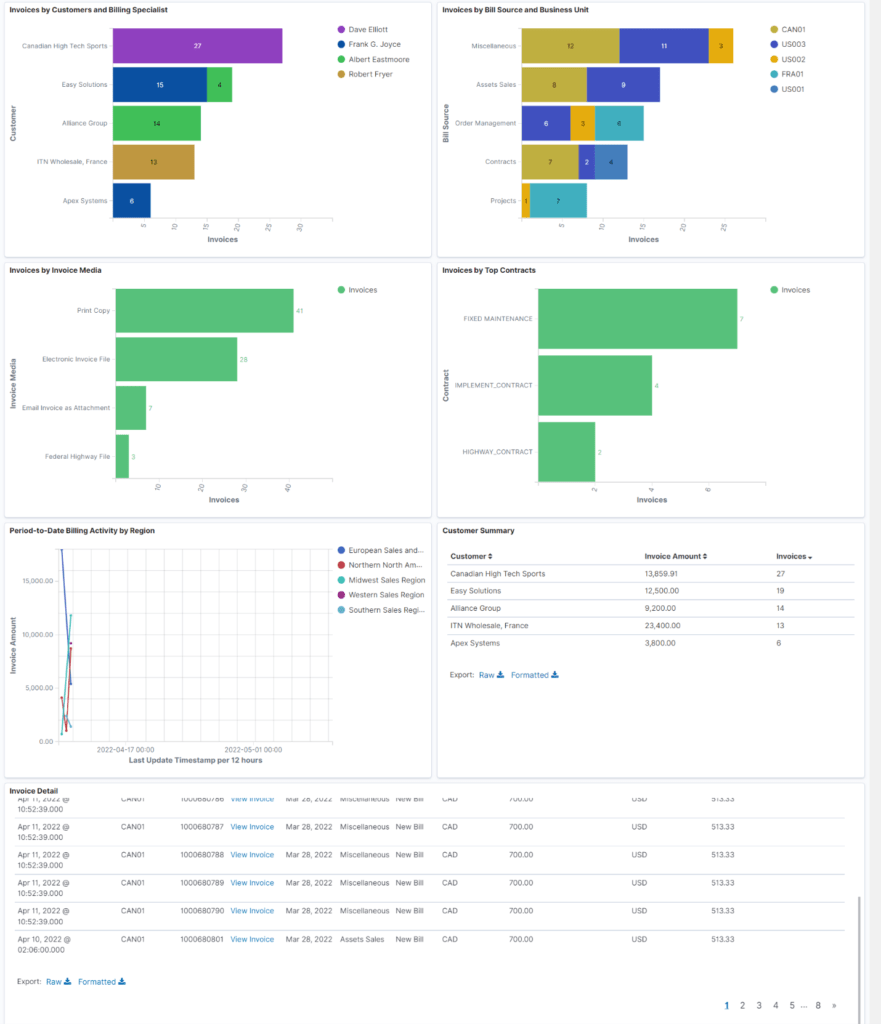
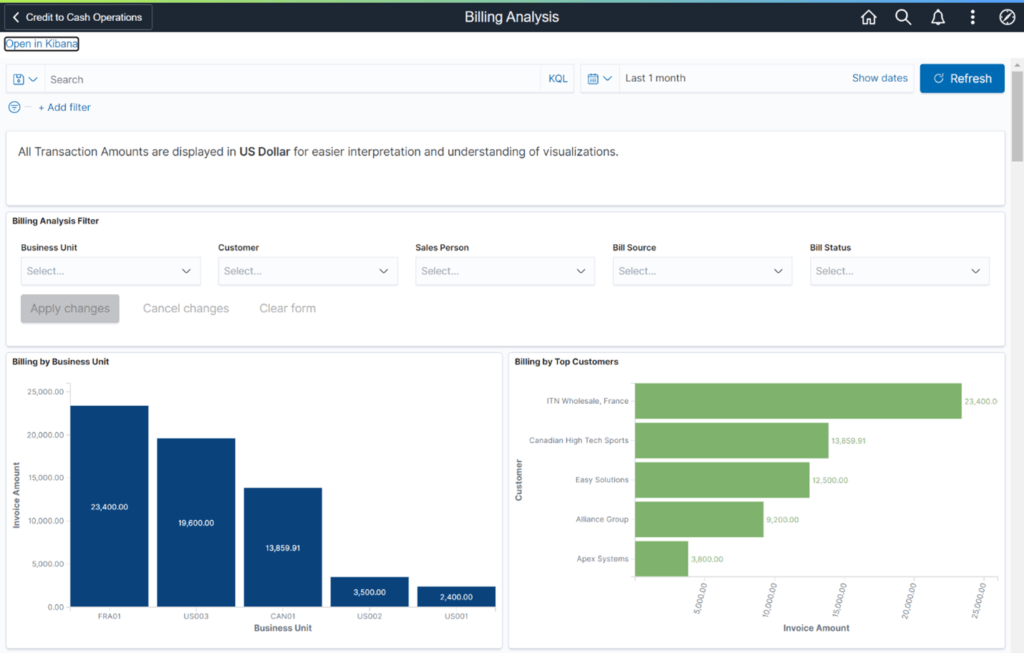
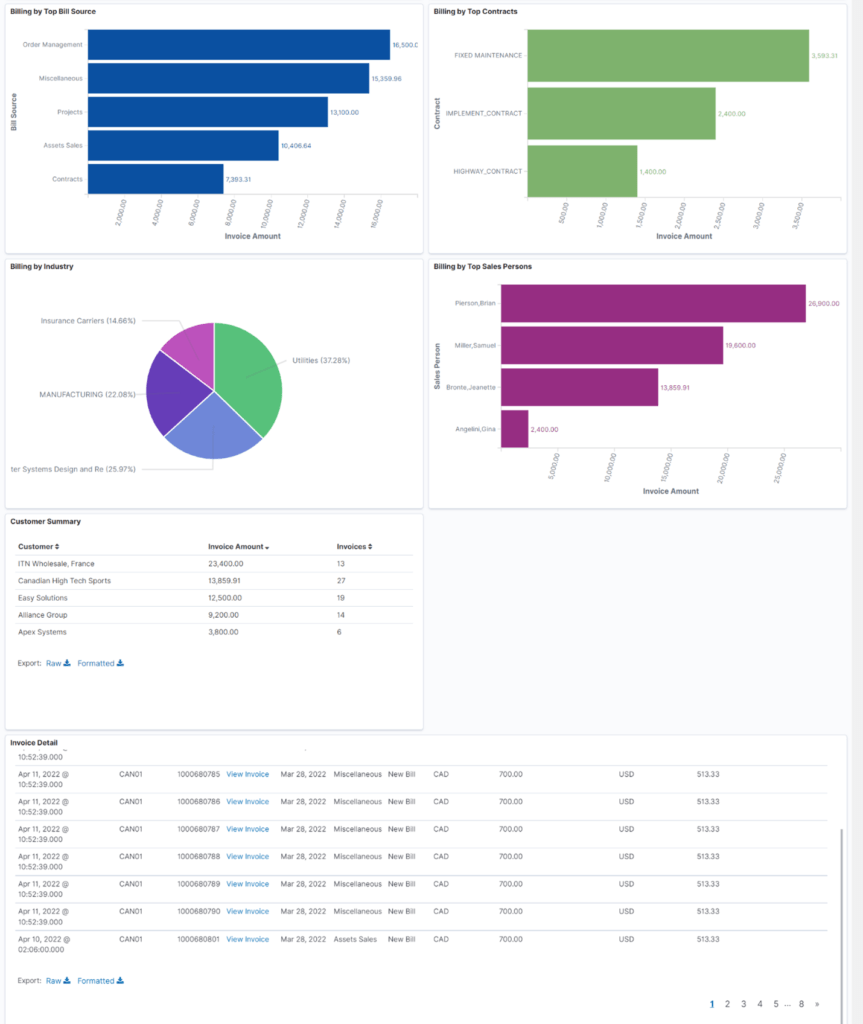
Billing: Enhanced Billing Revenue analytics using Kibana dashboards – two new dashboards are added. The Billing Operations dashboard helps to analyze the number of invoices processed, and the Billing Analysis dashboard helps to analyze the billing amounts within a selected time frame.
First, let’s look at the Billing Operations Dashboard:
Dashboard 1 of 2:
Dashboard 2 of 2:
Second, let’s look at the Billing Analysis Dashboard.
Dashboard 1 of 2:
Dashboard 2 of 2:
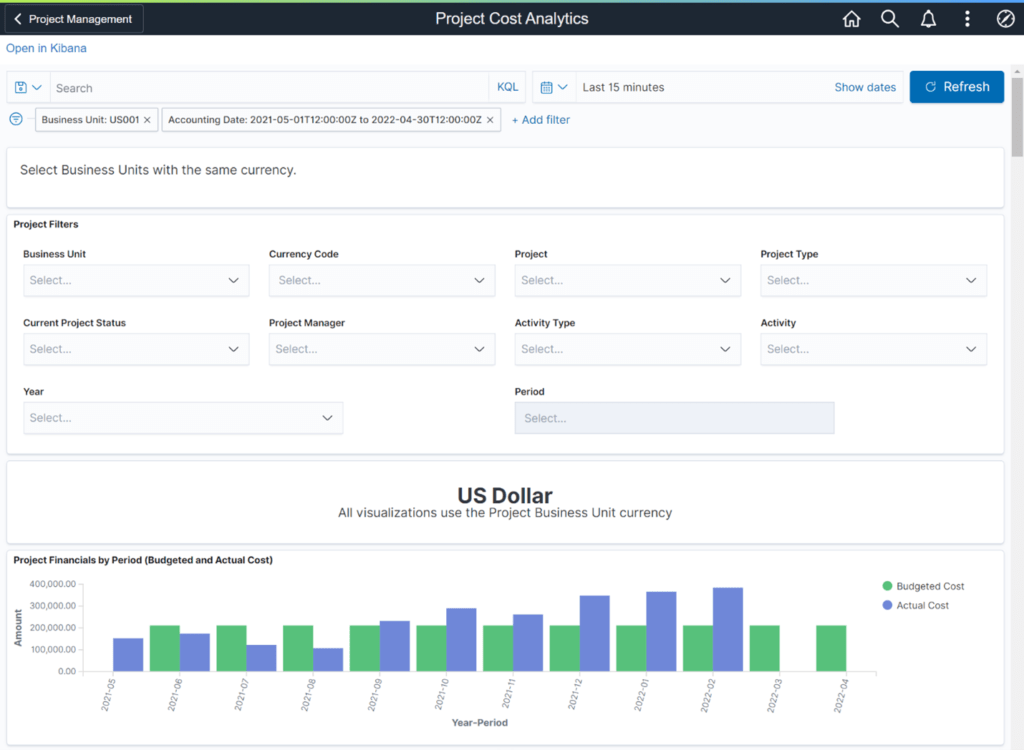
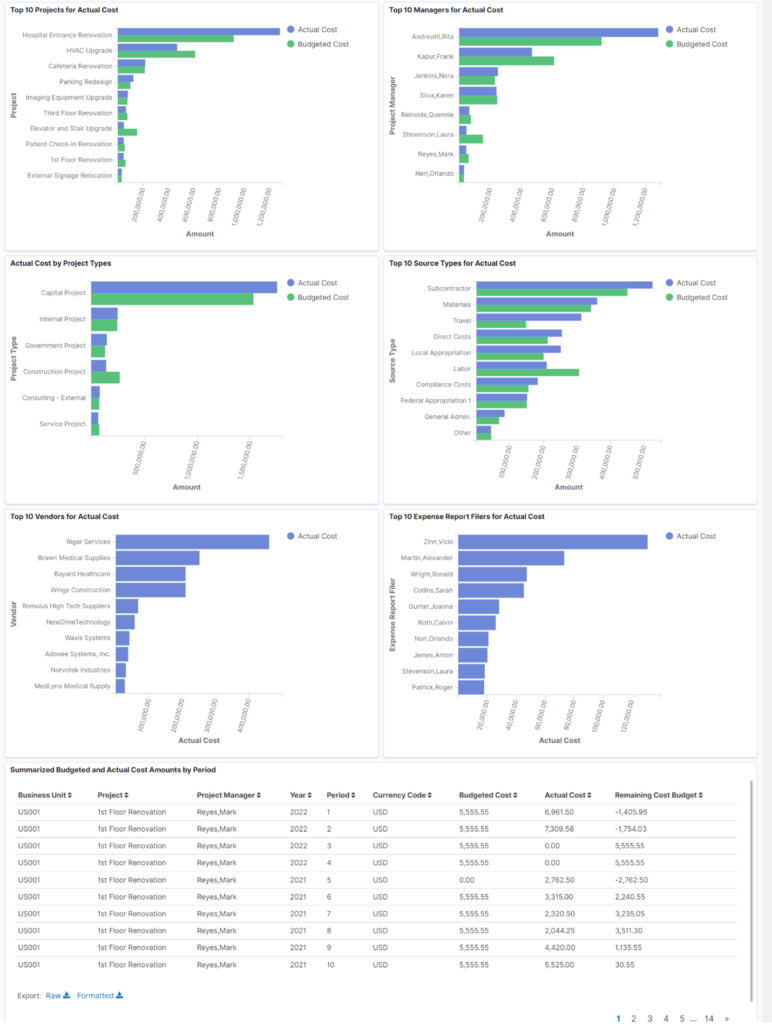
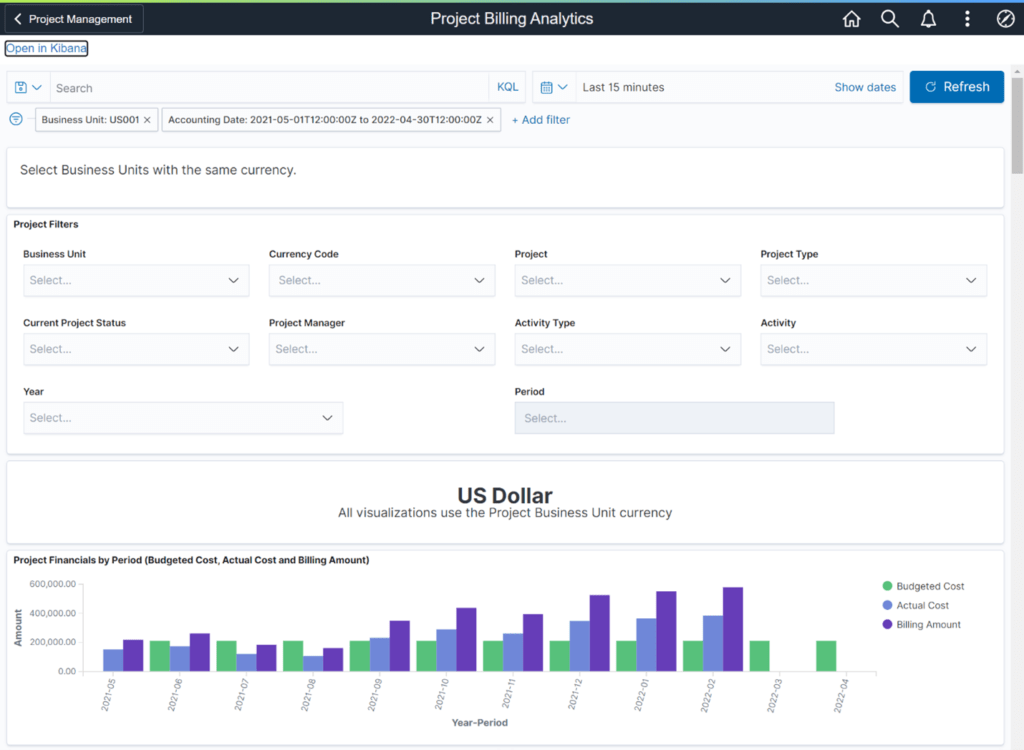
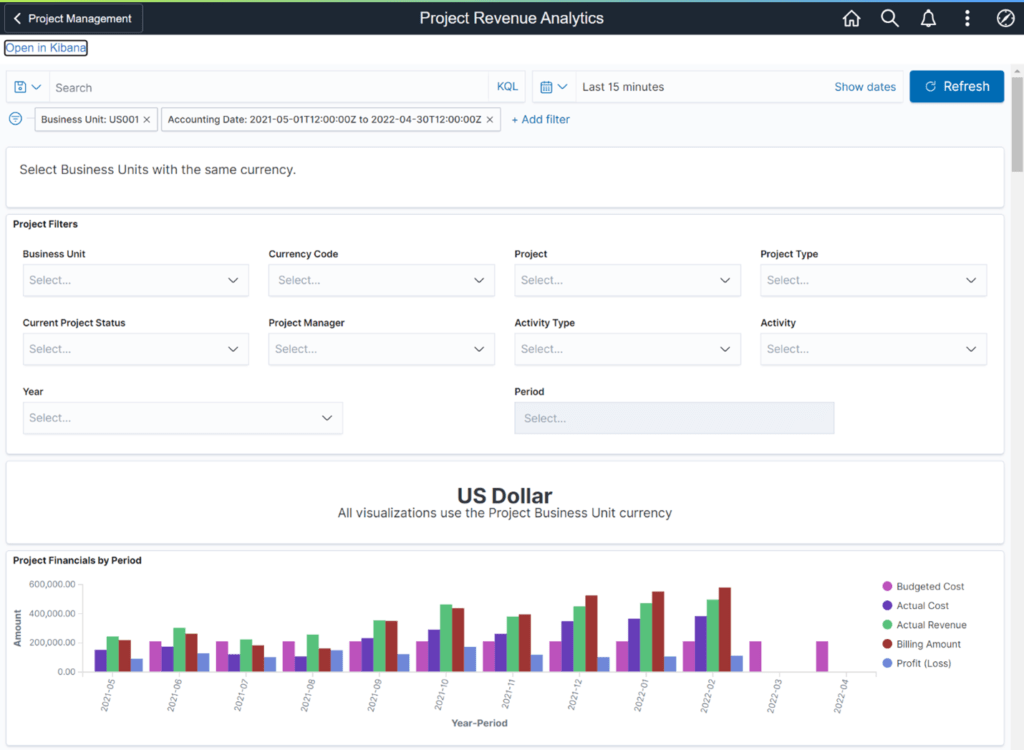
Project Analytics: Four Project Analytics Dashboards are added to the Project Management Homepage. Four new Kibana dashboards provide comparisons of Project Budgeted Cost, Actual Cost, Billing, Revenue and Profit, with detail by supplier, employee, project manager, and project type. Year-Over-Year Project Analytics compare Billing, Actual Cost, Revenue and Profit for the current and previous two years.
Project Cost Analytics
Dashboard 1 of 2:
Dashboard 2 of 2:
Project Analytics Dashboard
Dashboard 1 of 2:
Dashboard 2 of 2:

Project Revenue Analytics
Dashboard 1 of 2:
Dashboard 2 of 2:

Year-Over-Year Analytics
Dashboard 1 of 2:
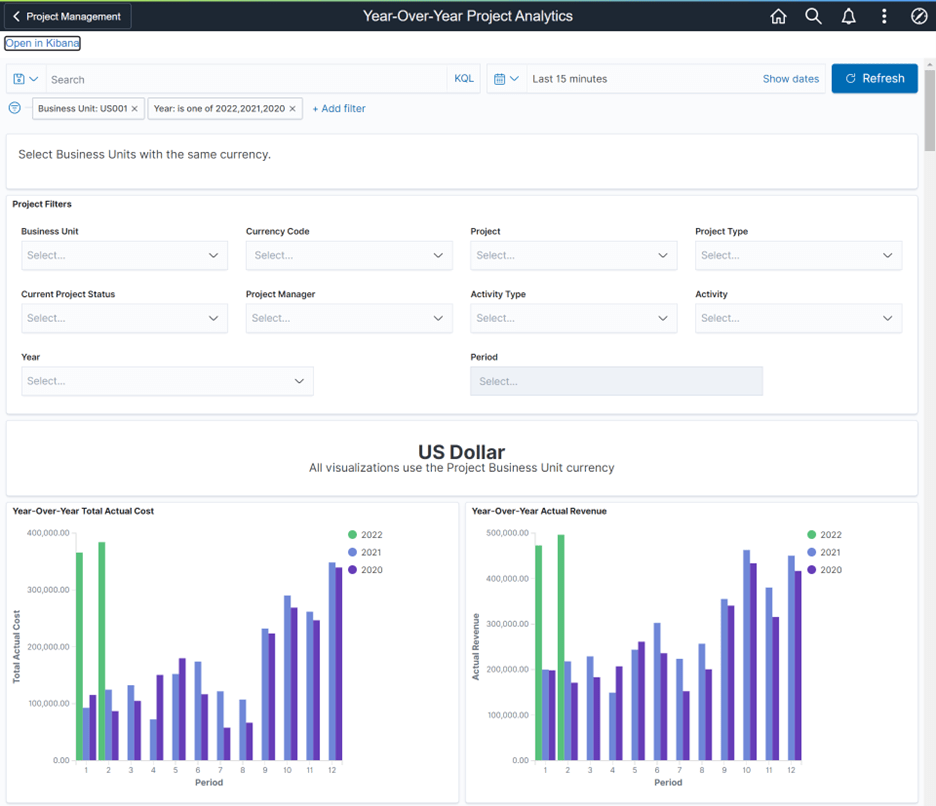
Dashboard 2 of 2:

PeopleSoft FSCM PUM Updates 43-45 includes Enhanced Receivables Analytics.
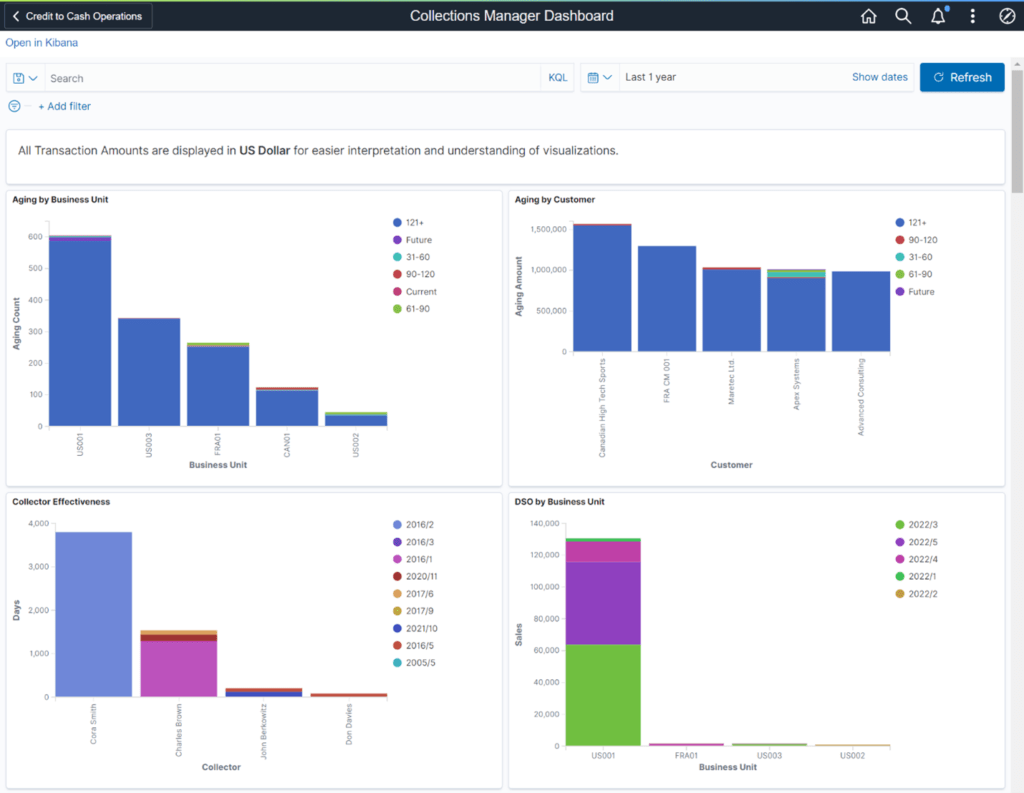
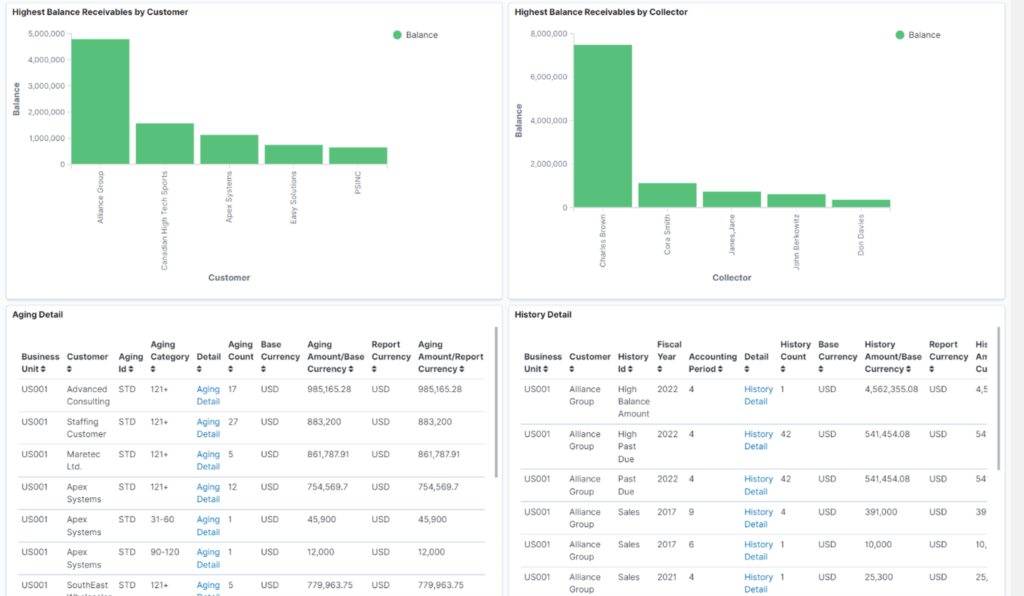
Enhanced Receivables Analytics using Kibana dashboards: Two new dashboards are added. Use the Collector Dashboard to view aging and history activity of the customers. Use the Collections Manager Dashboard to view aging and history activity across Receivables.
Collector Dashboard
Dashboard 1 of 2:
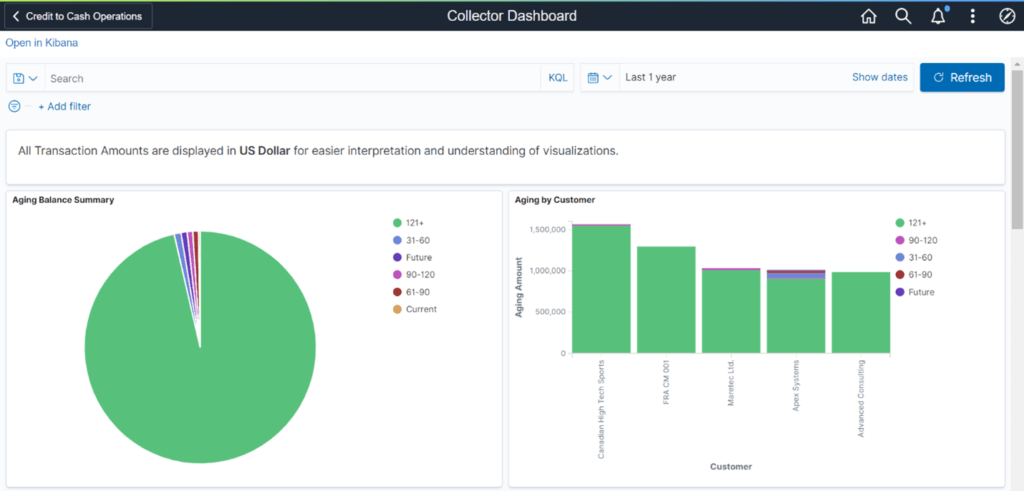
Dashboard 2 of 2:
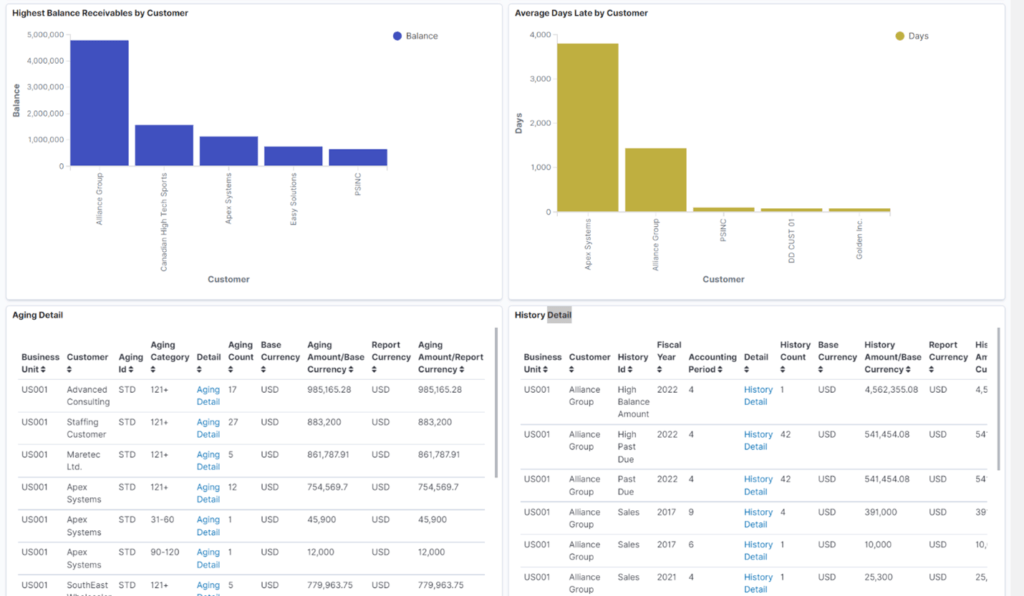
Dashboard 2 of 2:
Collector Manager Dashboard
Dashboard 1 of 2:
Dashboard 2 of 2:
Let’s look at some additional PeopleSoft FSCM PUM Updates 43-45.
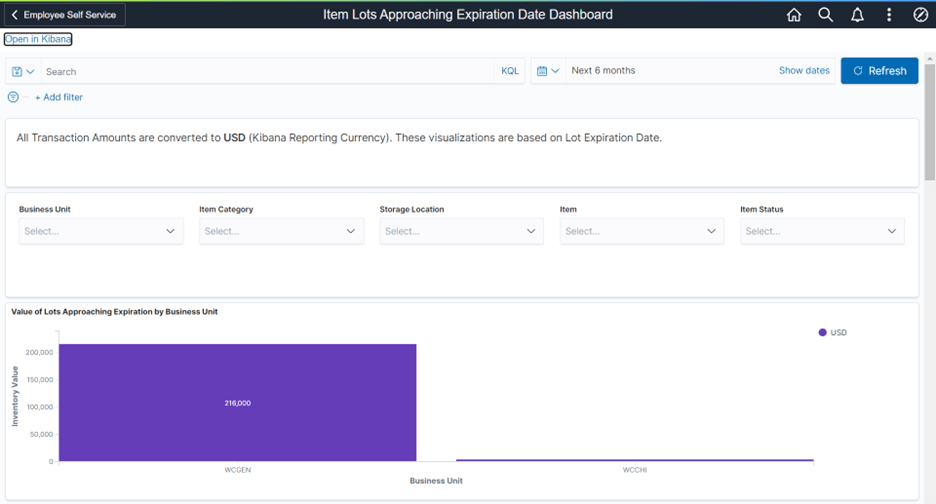
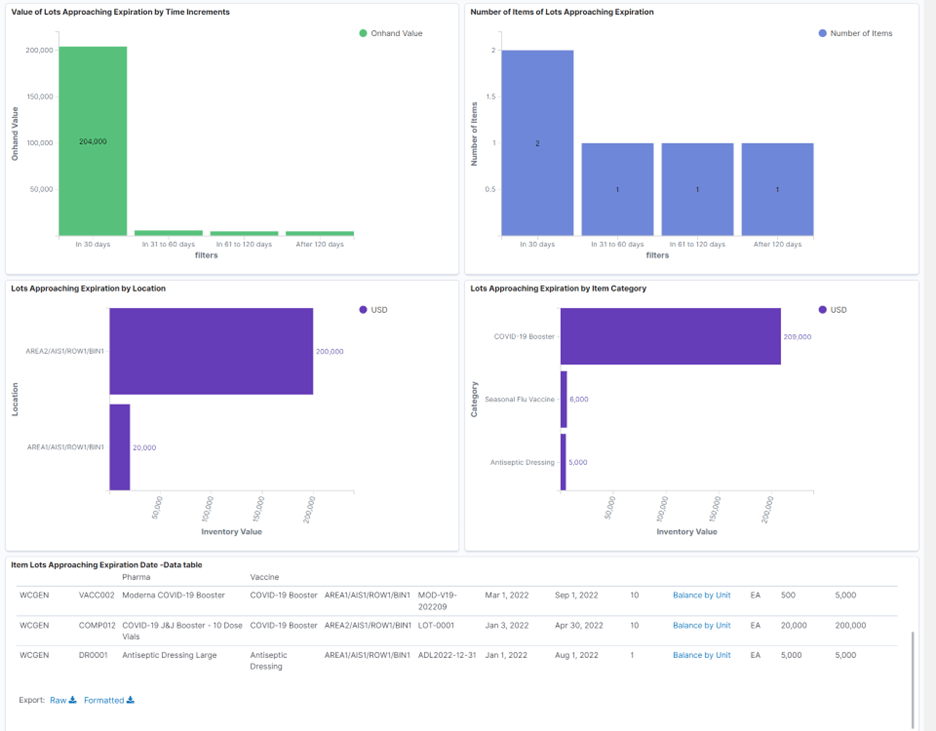
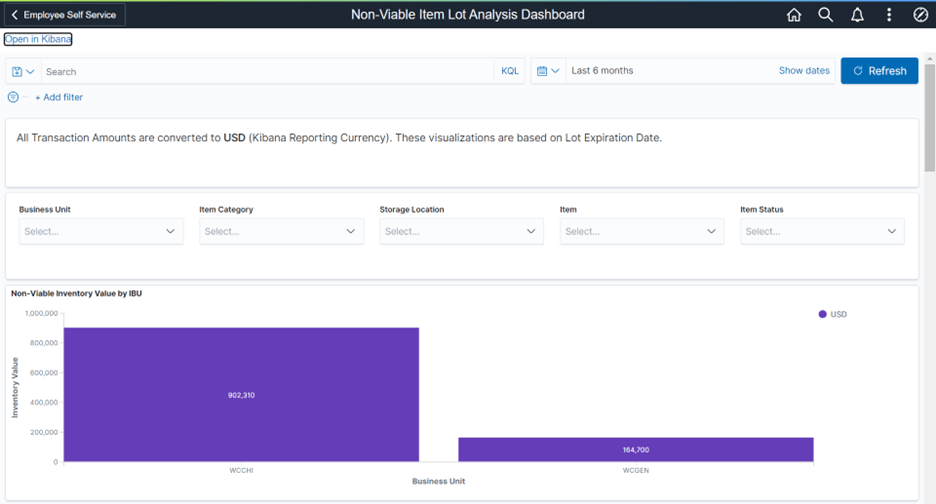
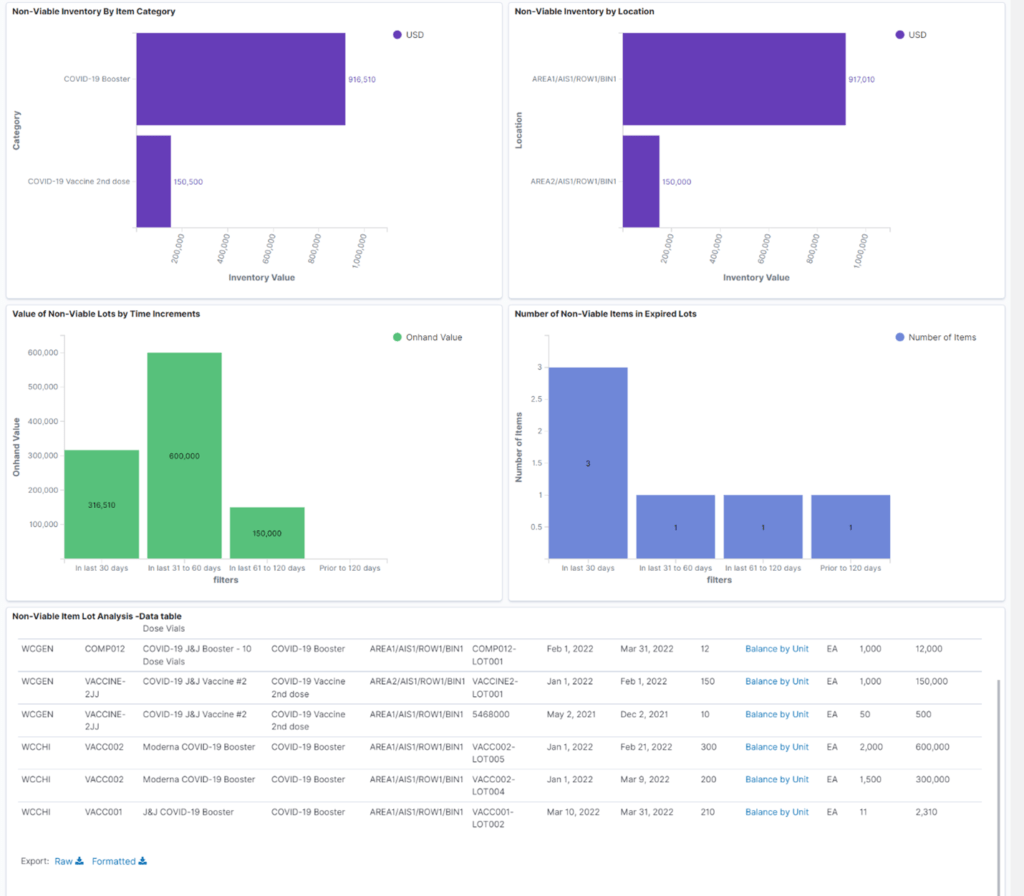
Enhanced Inventory Analytics using Kibana dashboards: Two new dashboards are added. First, the Item Lots Approaching Expiration Date Dashboard helps to analyze the item lots approaching expiration and, second, the Non-Viable Item Lot Analysis Dashboard helps to analyze expired item lots.
Item Lots Approaching Expiration
Dashboard 1 of 2:
Dashboard 2 of 2:
Non-Viable Item Lot Analysis
Dashboard 1 of 2:
Dashboard 2 of 2:
If you have any questions about any of the new analytics delivered in FSMC PUM Updates 43-45 or need any additional information, please email me at larry.zagata@miproconsulting.com.
Read my blog for information about HCM PUM Updates 42-44.


