PeopleSoft Applications 9.2 Update Image 10 added the Configurable Analysis Framework (CAF) which allows administrators to use a common framework to configure end-user pages to analyze cross-application data. This is a powerful and useful component to the 360 degree supplier.
The data can be viewed in analysis mode and comparison mode. Analysis mode focuses on a single supplier while comparison mode can view data across multiple suppliers. Since most people are familiar with the 360 degree view by now, let’s look at the comparison mode.
When in analysis mode, next to the supplier name is a chart, click on the chart to enter comparison mode.

There are two major decisions to be made at comparison mode. The first is to choose what suppliers to compare by clicking on the Suppliers drop down.
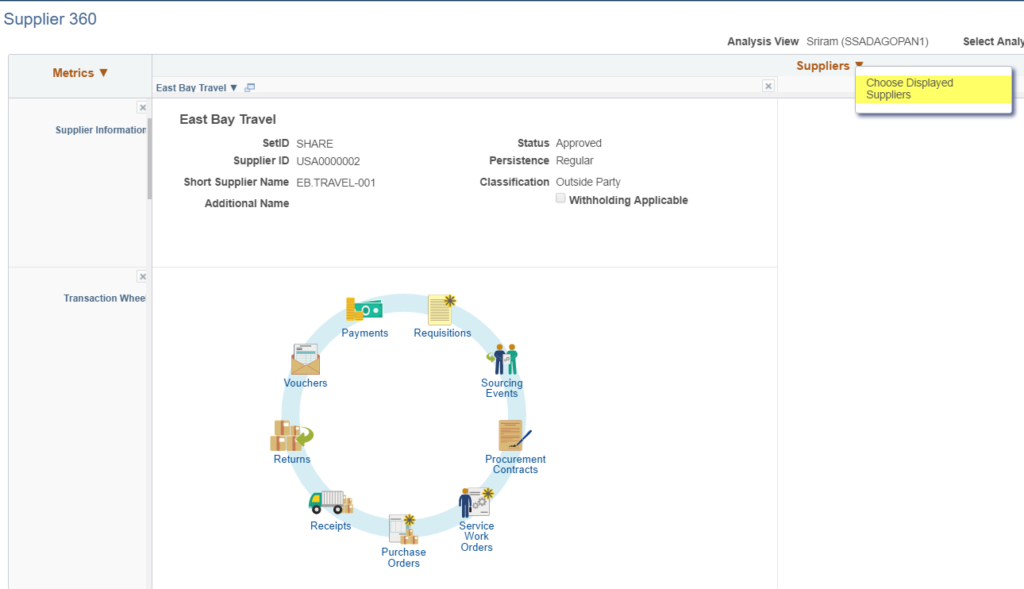
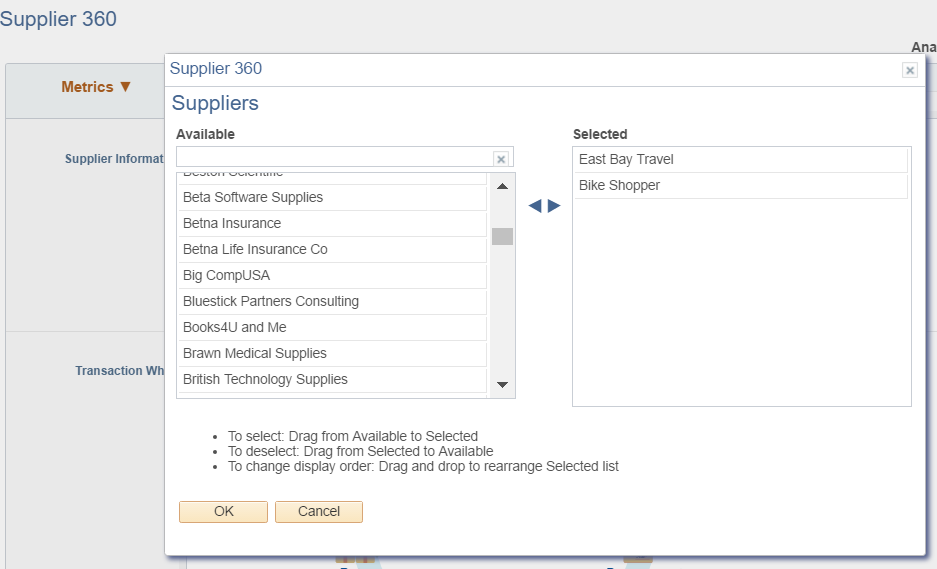
Drop and drag all of the suppliers you want to compare and click OK.
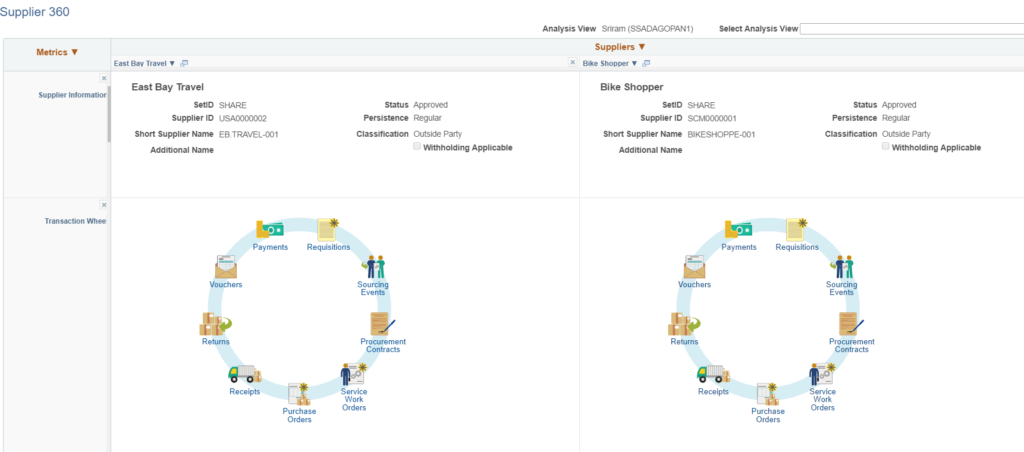
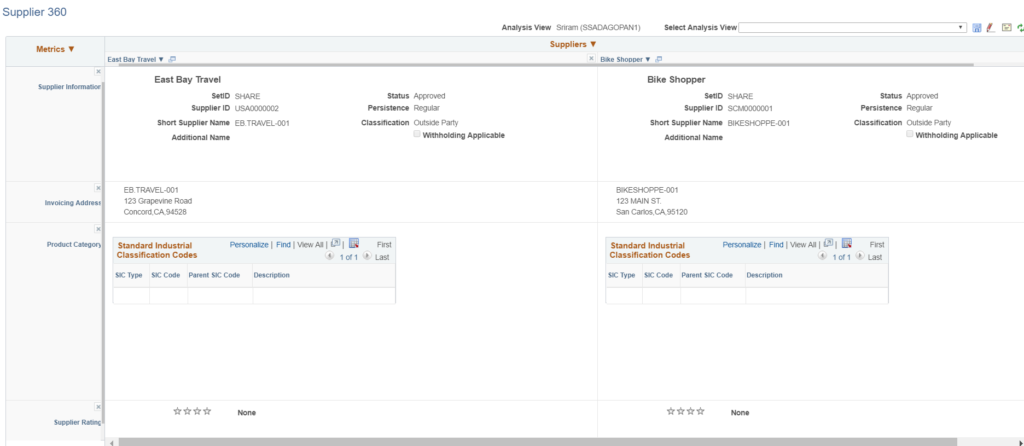
You will see the suppliers you selected in a grid or table format.
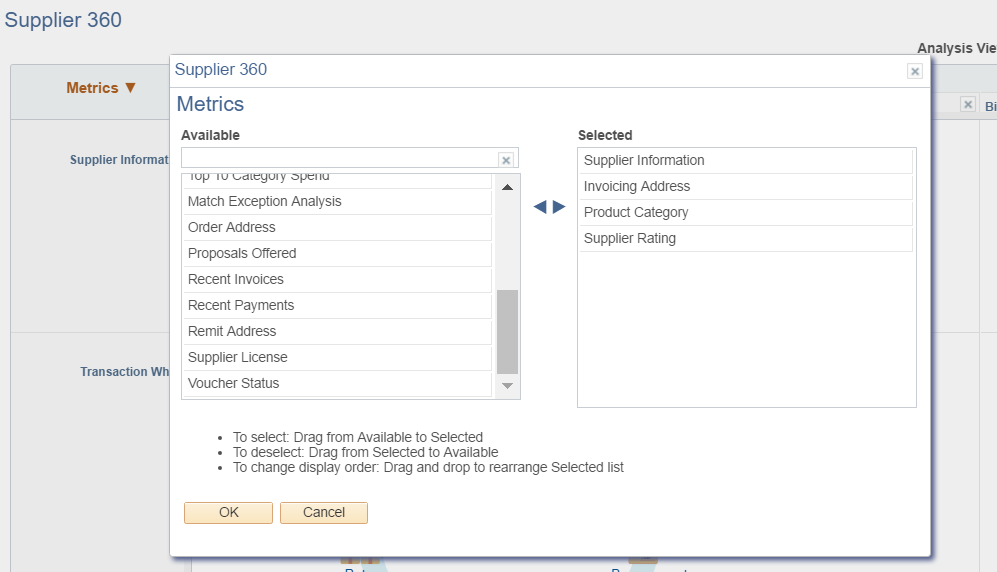
The second major decision that needs to be made is the metrics that you want to compare between the two suppliers. You do this by clicking on the Metrics tab.
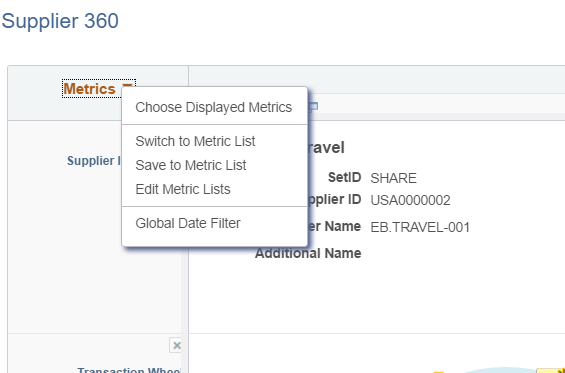
Clicking on Choose Displayed Metrics will then allow the user to select the metrics to compare. Simply drop and drag from the available metrics list to the selected and click OK.
The comparison chart will be displayed with the metrics on the left in rows and the suppliers in columns.
This can really provide some valuable information when comparing suppliers and making decisions about what suppliers to engage with on an opportunity. If you would like more information on comparison analysis mode, please contact me at larry.zagata@miproconsulting.com.


